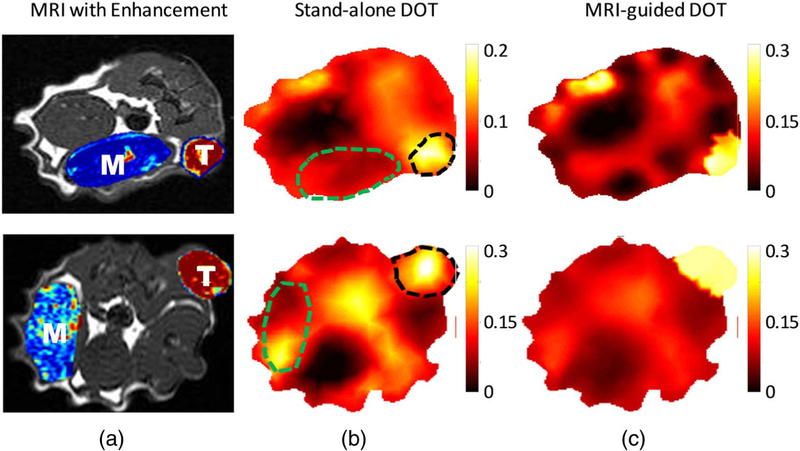
Fig. 2.
Low heterogeneous tumors with strong uniform enhancement in the tumor. The images in the top and bottom row correspond to rat 1 and 5, respectively, in Table 1. (a) T1 weighted MR images of the rat with the peak DCE enhancement map of the tumor (indicated as “T”) and muscle (indicated as “M”) region superimposed. The DOT reconstructed HbT maps (μM) (b) without and (c) with MRI structural a priori information is shown. The T and M region are indicated by black and green dashed lines.

