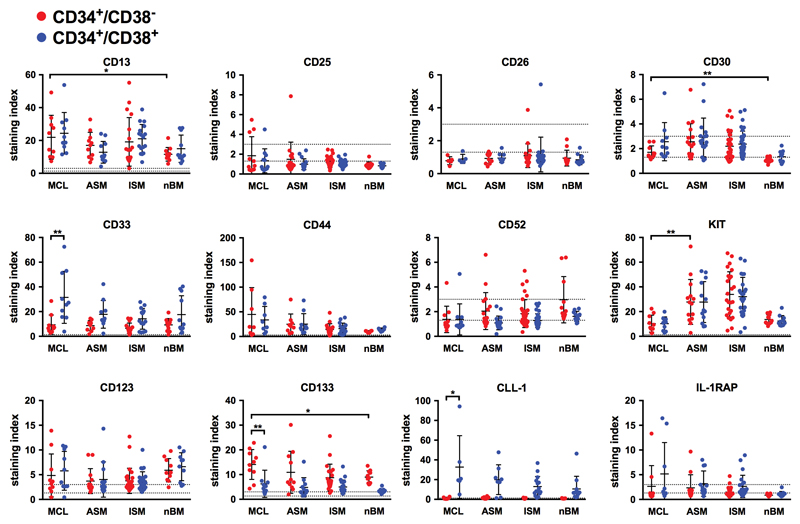
Figure 2. Evaluation of surface marker- and target expression profiles in MCL CD34+/CD38− and CD34+/CD38+ cells.
Expression of cell surface antigens on CD34+/CD38− (●) and CD34+/CD38+ cells (●) obtained from the BM of patients with mast cell leukemia (MCL, n=11), aggressive systemic mastocytosis (ASM, n=17) and indolent systemic mastocytosis (ISM, n=35) was determined by multi-color flow cytometry (see also Figure S1, Table S5). Sample details are summarized in Tables S1A-C. CD34+/CD38− and CD34+/CD38+ cells obtained from healthy/reactive BM (nBM, n=11) served as controls. Results are expressed as dot blots and indicate the staining index (=median fluorescence intensitymarker / median fluorescence intensityisotype control) for each individual patient (dots) as well as the mean expression levels (bars) for each marker. Dotted horizontal lines represent cut-off values for negativity (staining index <1.0) and positivity (staining index >1.3). Samples located between these lines were considered weakly positive (staining index 1.0 – 2.99). * p<0.05; ** p<0.01 (student’s t-test with Bonferroni correction).

