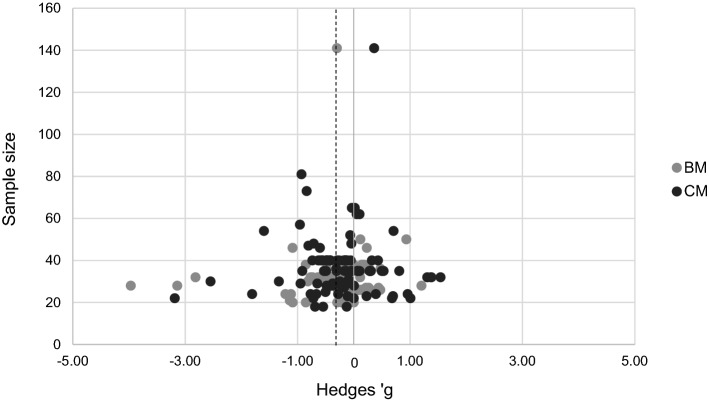
Fig. 2.
Funnel plot of the 227 effect sizes (Hedges’ g) as a function of the sample size. Negative effect sizes indicate worse performance for individuals with ASD compared with the TD group. The dotted line represents the mean estimated effect size, − .30, while the full line represents a mean estimated effect size of zero. BM biological motion, CM coherent motion

