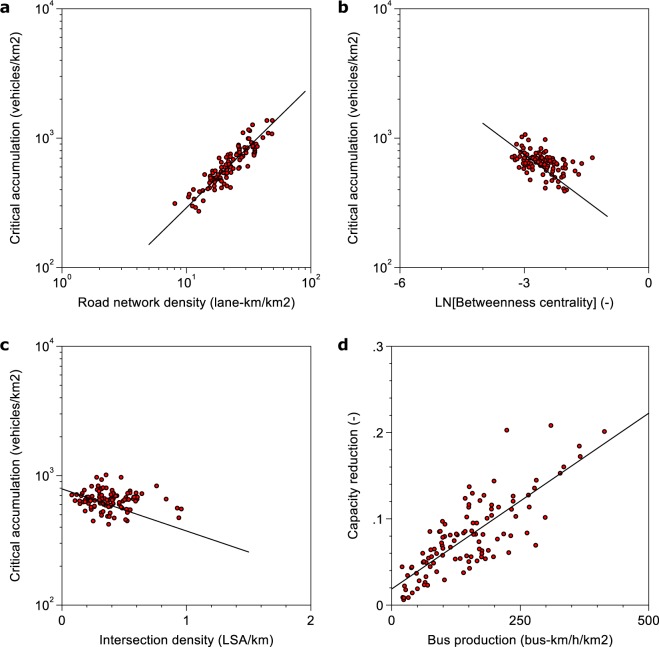
Figure 3.
Illustration of the effects in the critical point model. (a) Influence of road network density on critical accumulation. (b) Influence of betweenness centrality (network redundancy) on critical accumulation. (c) Influence of intersection density on critical accumulation. (d) Capacity reduction by bus operations in the network. Panels (a–c) are constructed as follows. We first residualize the x- and y-variables on the other control variables of the critical point model as given in Table 1. Secondly, we add back the unconditional mean of the x- and y-variables to the residuals. Panel (d) is constructed by calculating each network’s capacity at zero bus production and then calculating the relative difference to the observed capacity. The solid black line in each panel corresponds to the linear fit of the scatterplots.

