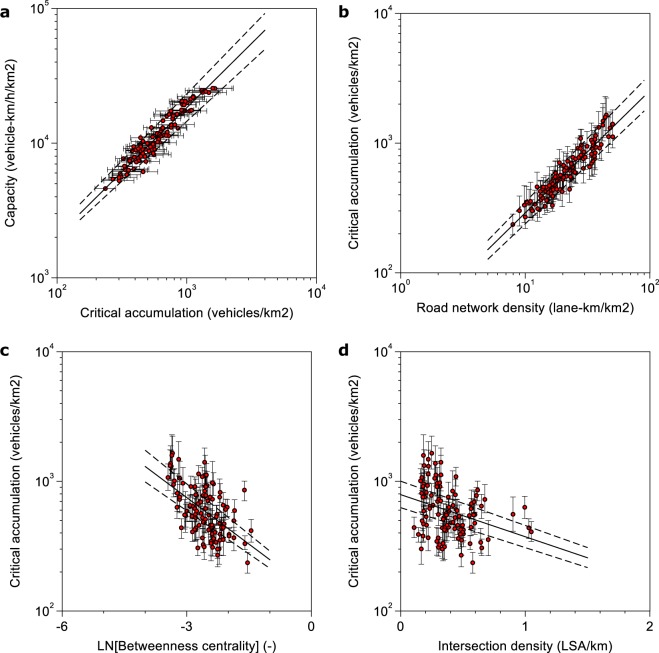
Figure 4.
Robustness check for the situation if the critical accumulation becomes an interval. The points in each panel correspond to the estimated maximum of each MFD, while the horizontal or vertical bars describe the interval in accumulation that results from a 5% reduction of the capacity. (a) Scatterplot capacity versus accumulation. (b) Influence of road network density. (c) Influence of betweenness centrality. (d) Influence of intersection density.

