Fig. 5.
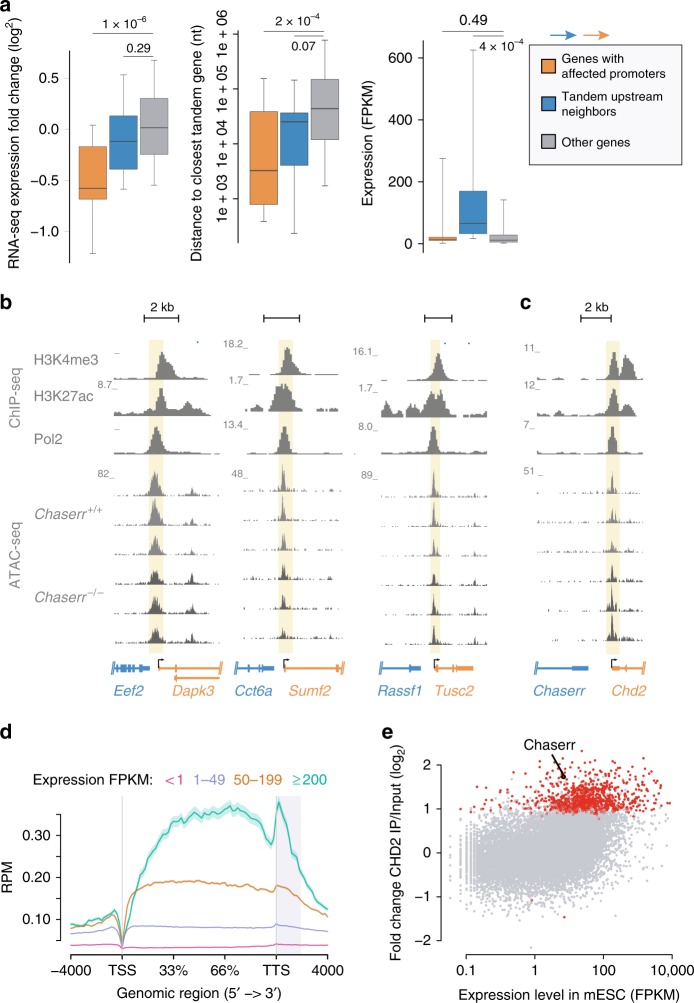
Changes in chromatin accessibility following loss of Chaserr. a Changes in gene expression in Chaserr−/− mEFs, distance to the closest upstream gene transcribed from the same strand, and the expression levels, for genes assigned to promoter peaks with reduced accessibility in Chaserr−/− mEFs, their upstream neighbors on the same strand, and all other genes. Only genes with ATAC-seq peaks at their promoters were considered. P-values computed with two-sided Wilcoxon rank-sum test. Boxplots show the 5th, 25th, 50th, 75th, and 95th percentiles. b Examples of loci of genes with reduced accessibility in their core promoters in the Chaserr−/− background. Top: ChIP-seq coverage in mEFs from the ENCODE project. Bottom: read coverage in ATAC-seq data from mEFs isolated from three embryos from each background. c As in b, for the Chaserr/Chd2 locus. d Metagene of CHD2 occupancy10 on genes in mESCs, divided into four groups based on their expression FPKM. e Enrichment of CHD2 occupancy in mESCs in the 2-kb region downstream of the TTS when compared with input, as a function of mESC gene expression levels. Genes with adjusted P < 0.05 are in red. Source data are provided as a Source Data file

