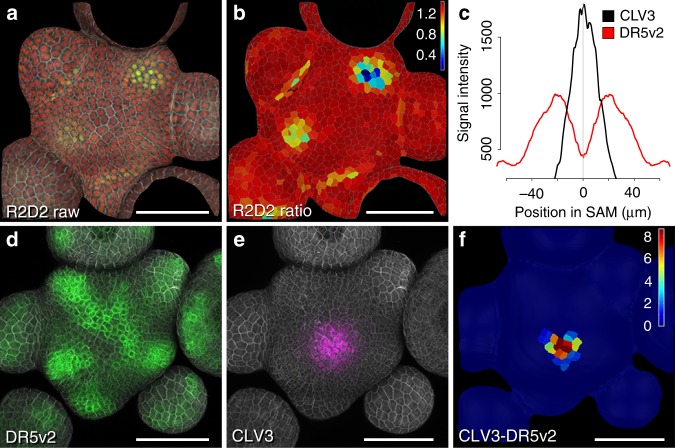
Fig. 1.
Auxin output minimum correlates with apical stem cells. a Confocal readout from R2D2 auxin input sensor. b Ratiometric representation of R2D2 activity in the epidermal cell layer (L1). c Quantification of averaged pDR5v2:ER-eYFP-HDEL and pCLV3:mCherry-NLS distribution (n = 5). d Confocal readout from pDR5v2:ER-eYFP-HDEL auxin output reporter. e pCLV3:mCherry-NLS stem cell marker in the same SAM. f Computational subtraction of L1 signals shown in d and e. Relative signal intensity is shown in arbitrary units. Scale bars: 50 µm

