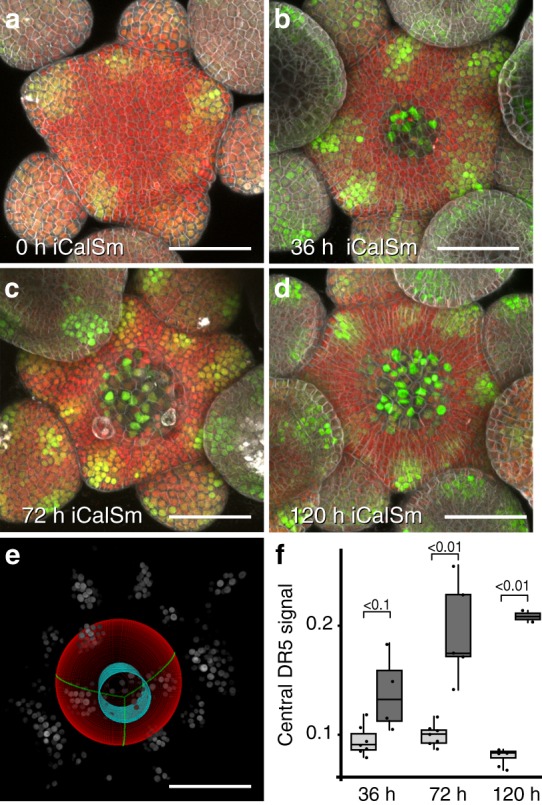
Fig. 2.

The central auxin signaling minimum is dependent on stem cell fate. a–d pDR5v2:3xVENUS-NLS activity after stem cell specific induction of iCalSm. Stem cell differentiation is marked by loss of pRPS5a:NLS-tdTomato. Independent channels and Z-projections are shown in Supplementary Fig. 1. e Computational sphere fitting and identification of the central zone for fluorescence signal quantification (see Supplementary Fig. 2). f Quantification of DR5v2 signal intensity in the central zone across the experimental cohort described in Supplementary Fig. 2. Light gray boxes represent uninduced controls, dark gray boxes represent plants induced with 1% ethanol. Individual analyzed SAMs are indicated as dots. Analysis of variance (ANOVA) showed significant variation between control and induced samples. Post hoc Turkey test p values are shown. Scale bars: 50 µm. See also Supplementary Fig. 2
