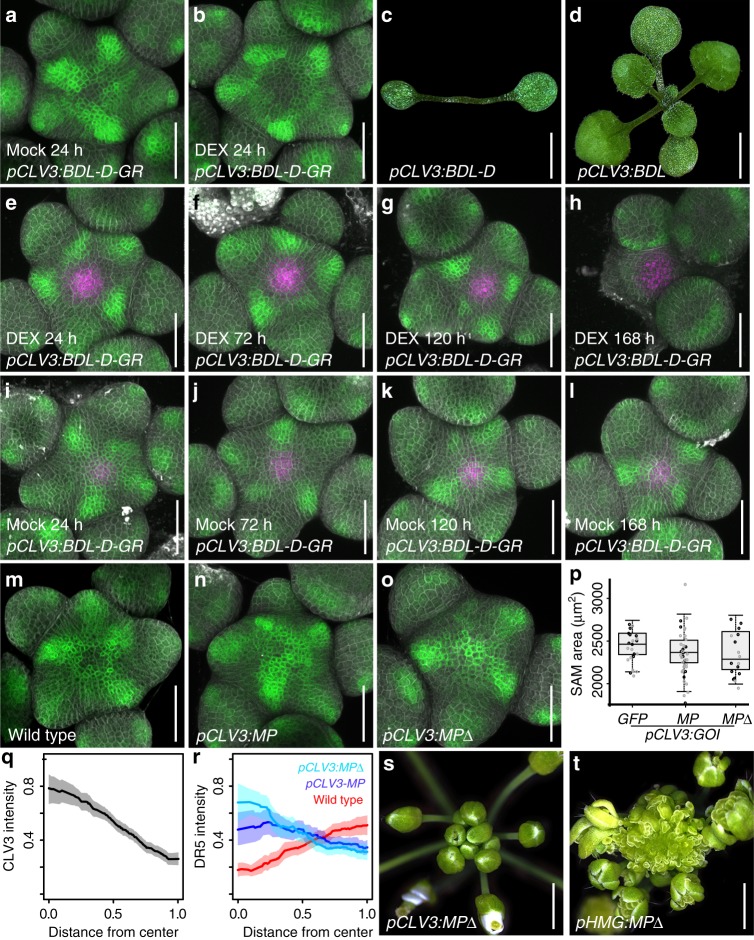
Fig. 3.
Stem cells require auxin signaling to remain active, but are resistant to overactivation of the pathway. a pDR5v2:ER-eYFP-HDEL activity in plants harboring pCLV3:BDL-D-GR after 24 h of mock treatment. b DR5v2 signal after 24 h of DEX treatment. c, d Representative phenotypes of lines expressing pCLV3:BDL-D (c) and pCLV3:BDL (d). e–l Response of DR5v2 and CLV3 to induction of pCLV3:BDL-D-GR over time. pDR5v2:ER-eYFP-HDEL shown in green, pCLV3:mCherry-NLS shown in magenta. CLV3 signal is expanded and sustained until the meristem terminates. i–l Mock treated pCLV3:BDL-D-GR controls. m–o Activity of DR5v2 in SAMs with enhanced auxin signaling in the central zone. m wild type control, (n) pCLV3:MP, (o) pCLV3:MP∆. p SAM size quantifications for plants carrying pCLV3:GFP, pCLV3:MP, or pCLV3:MP∆ in two independent T1 populations. q Quantification of pCLV3:mCherry-NLS signal strength in wild type (n = 4). r Quantification of pDR5v2:ER-eYFP-HDEL signal strength in wild type (red, n = 4), pCLV3:MP (light blue, n = 4) and pCLV3:MP∆ (purple, n = 4). In q and r kernel regression was used to visualize dependence of fluorescence signal from SAM center. 95% confidence intervals were simulated using bootstrapping (10.000 iterations) and are shown in lighter colors. s, t Representative phenotypes of lines expressing pCLV3:MP∆ (s) and pHMG:MP∆ (t). All scale bars 50 µm, except c and d 2 mm; (s) and (t) 3.5 mm

