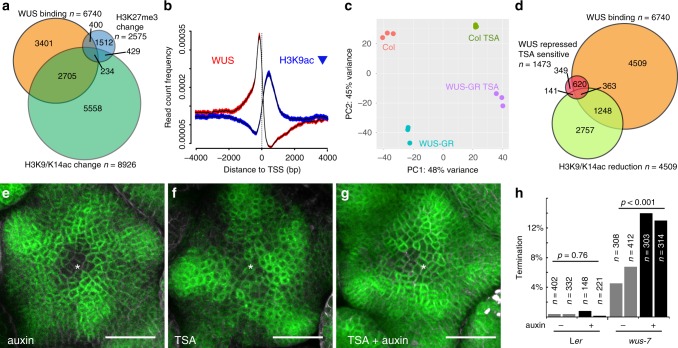
Fig. 6.
WUS acts by regulating the histone acetylation status of target loci. a Venn diagram showing the overlap between WUS binding regions (orange), and loci with significant changes in H3K9K14ac (green) or H3K27me3 (blue) status. b Spatial correlation between WUS chromatin binding events (red) and regions with reduced histone acetylation (blue) 0.95 confidence intervals are shown. c PCA showing the global transcriptional response to WUS-GR activation in the presence or absence of TSA. TSA treatment suppressed almost 50% of gene expression variance caused by activation of WUS-GR. d Venn diagram showing the overlap between WUS binding regions (orange), and loci with significant reduction in H3K9K14ac (light green) and genes whose expression was reduced by WUS in a TSA sensitive manner (red). e–g Representative images of pDR5v2:ER-eYFP-HDEL activity in response to HDAC inhibition. e Auxin treated SAM; f TSA treated SAM; g TSA and auxin treated SAM. Asterisk denote center of the SAM. h Quantification of terminated seedlings grown on auxin plates from two independent experiments. On mock 5.8% seedlings (n = 720) segregating wus-7 terminated; on 10 µM IAA 13.3% seedlings (n = 617) segregating wus-7 terminated. Genotyping revealed that all arrested plants were homozygous for wus-7. For Ler controls 0,4% seedlings arrested on mock (n = 734) and 0.5% on 10 µM IAA (n = 369). p–values calculated by chi-square test. Scale bars 30 µm

