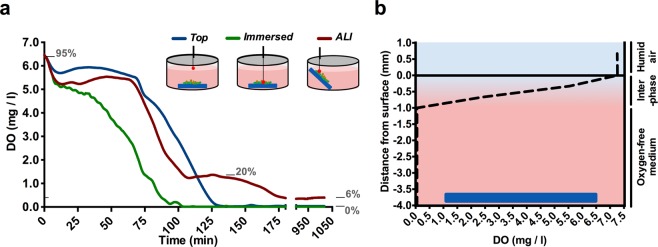
Figure 5.
Differences in oxygen concentration depending on the position in the well where PA14 and Newman are cocultured and growing. Dissolved oxygen concentration (DO) was determined in the different areas of interest in the PA14 and Newman in vitro coculture biofilm model. (a) Plot shows the DO (mg/L; ppm) given by the optical fiber microsensor, depending on the position placed in the coculture system: top, immersed and in the ALI area. A schematic showing the approximate position of each measurement is included in the plot. The equivalence of significant DO values to the percentage of dissolved oxygen saturation (gray numbers) is provided as a reference. (b) DO at different depths of the culture well after the immersed area reached a DO of 0 mg/L (approximately 85 min of incubation). An interpretation of the oxygenation states across the different layers is provided on the right: 1, humid air (the oxygen value is a result of the saturation of the sensor); 2, oxygenated interphase; and 3, anaerobic culture.

