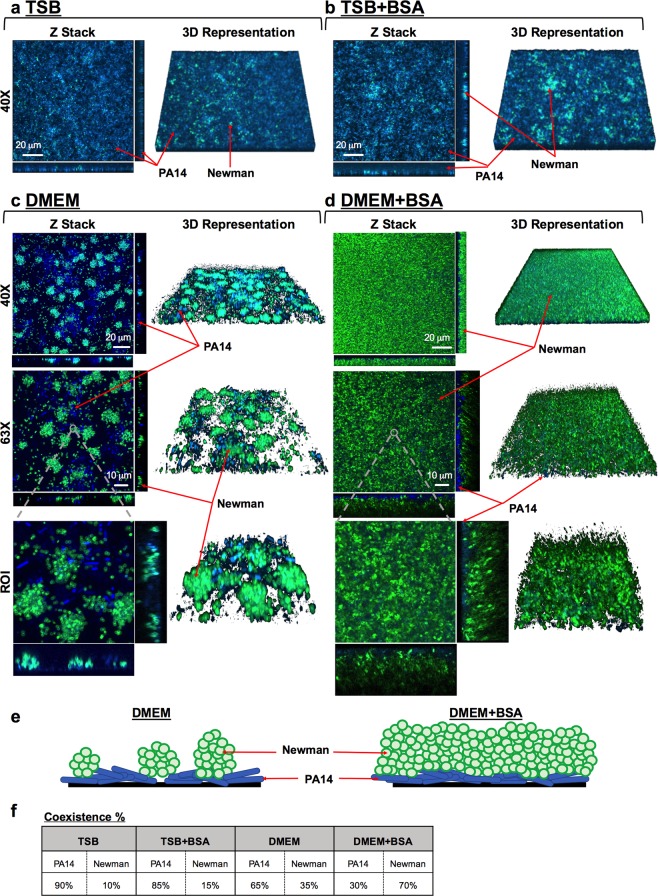
Figure 6.
Balanced and stable P. aeruginosa PA14 and S. aureus Newman strain populations within a three-day-old mixed biofilm grown in continuous flow. PA14 and Newman were grown simultaneously in a continuous-flow biofilm in TSB (a), TSB + BSA (b), DMEM (c) and DMEM + BSA (d) for three days. At the indicated time point, the biomass growing over the different channels was stained with DAPI (blue, PA14) and CFTM-488A (green, Newman) and visualized using confocal microscopy. The figure shows the composite of the sum of the slices (Z Stack), with the respective orthogonal views, and the 3D representation of each mixed biofilm formed using both ImageJ and ZEN software. Mixed biofilms were tested in triplicate, and a representative image from those taken at magnifications of 40X and 63X is shown. A region of interest (ROI), including the different microscope projections and representations, is also presented in the figure. Red arrows indicate PA14 and Newman strains within the mixed biofilm. (e) Schematic representations of the cocultured biofilm depending on growth in DMEM or DMEM + BSA from the previous confocal microscope Z-stacks and orthogonal views. P. aeruginosa is represented in blue, and S. aureus is represented in green. (f) Table shows the percentage of blue Pseudomonas and green Staphylococcus present in the different cocultured biofilms calculated from an average of 5–15 different microscope stacks using the COMSTAT 2 and ImageJ software.

