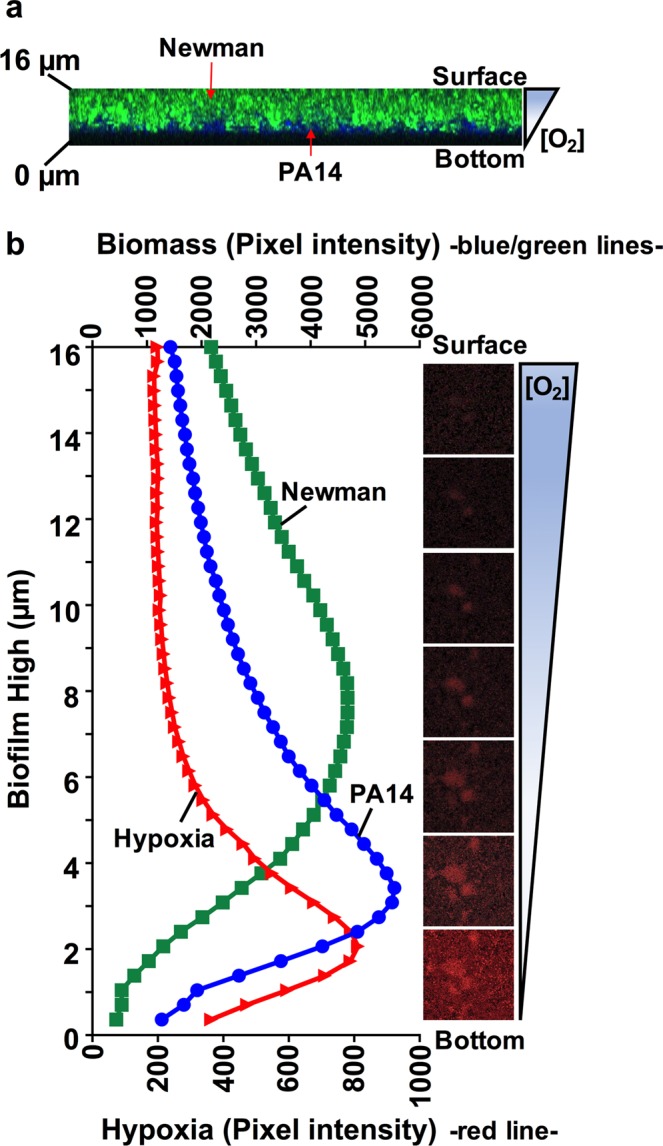
Figure 7.

Oxygen stratification within the cocultured biofilm determines the spatial distribution of P. aeruginosa and S. aureus and their coexistence. (a) XZ-orthogonal view of a P. aeruginosa and S. aureus coculture biofilm grown in DMEM + BSA (see Fig. 6d). The image shows the separate position of Newman and PA14 within the ∼16 μm-biofilm and the possible oxygen gradient present in the system. (b) Graph shows the average pixel intensities of PA14 (blue) and Newman (Green) biomasses (plotted on the upper Y-axis) compared to the oxygen-related red intensity (plotted on the lower Y-axis) along the different thicknesses (μm) of a 3-day-old cocultured biofilm in flow. Pixel intensity averages were calculated from ten different images using ImageJ software. Included in the figure, is a sequential set of micrographs showing the red fluorescence emission given by the hypoxia probe through the different biofilm layers, indicating the oxygen stratification present along the thickness of the continuous-flow cocultured biofilm. Intense red emission relates to the hypoxic environment through the different biofilm depths (μm), from the bottom to the surface, additionally indicated with a schematic of the oxygen gradient present in the system.
