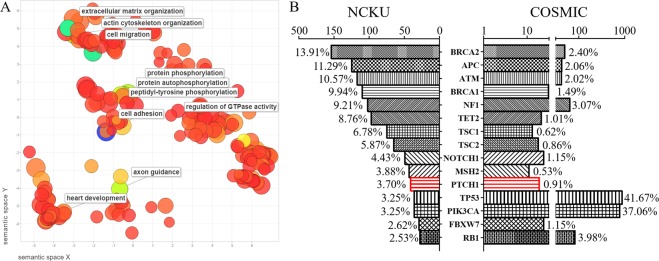
Figure 1.
Overview of frequently mutated genes in the present study and comparison with the COSMIC database of breast cancer. (A) The significantly enriched Gene Ontology (GO) terms were calculated by CLC Genomics Workbench according to the mutated genes from sequencing data, and the graph was plotted with the REViGO package for the top ten significant GO terms. Each of the GO terms represents a node in the graph. The scatterplot showing functional clusters according to biological processes and the bubble color refer to the p-values from the GO result, whereas the bubble size indicates the frequency of the biology process from the GO database. The larger bubbles have more general terms, and these bubbles were highly correlated with protein phosphorylation, such as peptidyl-tyrosine phosphorylation, protein phosphorylation, and protein autophosphorylation. (B) Mutation prevalence in our cohort and comparison with the COSMIC database. The X-axis is the total number of mutations in the particular gene. The percentage close to the bar is the number of mutations in the particular gene divided by sum of all mutations in these 15 genes.

