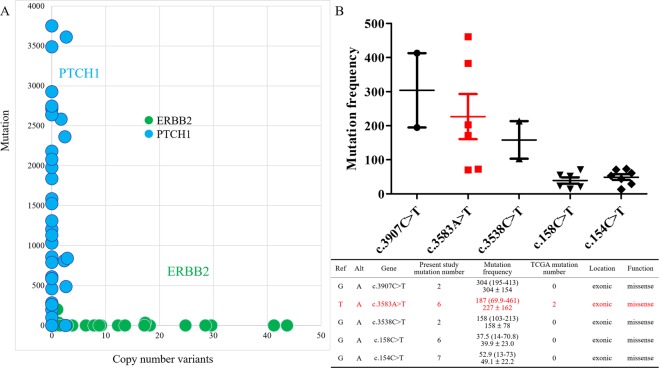
Figure 3.
Mutation allele frequency and copy-number variation of PTCH1 in breast cancer patients. (A) Comparison across 44 breast cancer samples by mutation allele frequency and copy-number variations (CNVs). ERBB2 had a high CNV rate but low mutant rate, whereas PTCH1 had a high mutation rate but an extremely low CNV rate in our study. (B) The upper graph shows the mutation frequencies of the top 5 mutation sites in PTCH1, including c.3907C > T, c.3583A > T, C.3538C > T, c.158C > T, and c.154C > T. Each dot represents an individual patient with a mutated gene. The mutation frequency was the product of allele frequency (AF) and read depth (DP). c.3583A > T had the highest mutation frequency and more patient number. The lower table shows detailed information. The mutation frequency is presented as median (range) and mean ± standard deviation. PTCH1 mutation sites (Alt) were compared with the reference genome (Ref). The biological function and patient number of each mutated site in the present study and in the TCGA database are also listed.

