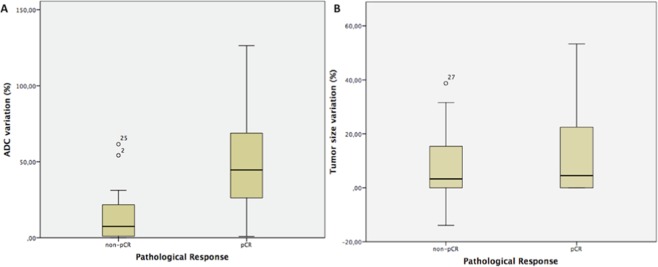
Figure 1.
(A,B) Box and whisker plots of changes in (A) ADC values and (B) tumor size before and after the first cycle of treatment (MR1 vs. MR2). The horizontal line within each box represents the median value. In (A), the outliers represent two non-responder cases: 1) ΔADC = 54.24%, there was a complete response in the breast lesion, however a positive axillary lymph node remained after surgery, thereby resulting in a non-pCR classification; 2) ΔADC = 61.56%, a substantial inflammatory effect was observed after the first cycle of NCT, and this resulted in high T2 signal intensity, an increase in ADC value, and an increase in breast enhancement, despite the absence of a complete pathological response after treatment. The morphology of both cases indicated non-mass enhancement lesions. In (B), the outlier represents a non-mass enhancement tumor that was fragmented and showed scattered areas throughout the tumor burden in MR2.

