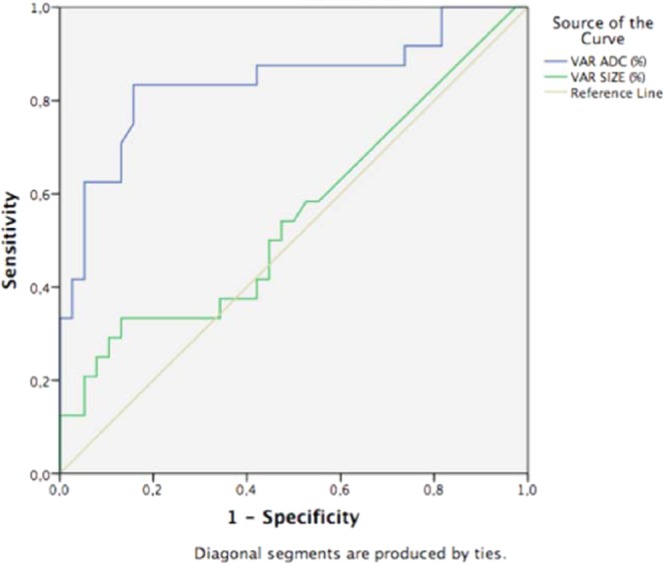
Figure 3.

ROC curves for using ADC (blue line) or DCE (green line) as predictors of early response in 62 patients with invasive breast cancer. The best percent ADC increase cutoff value for differentiating responders from non-responders after the first cycle of NCT was 25%, and the area under the ROC curve was 0.840 (95% confidence interval: 0.728, 0.953). The latter had a greater area under the curve compared with tumor size, thereby indicating that DW-MRI is a more effective method for predicting early NCT response than evaluating tumor size with DCE-MRI.
