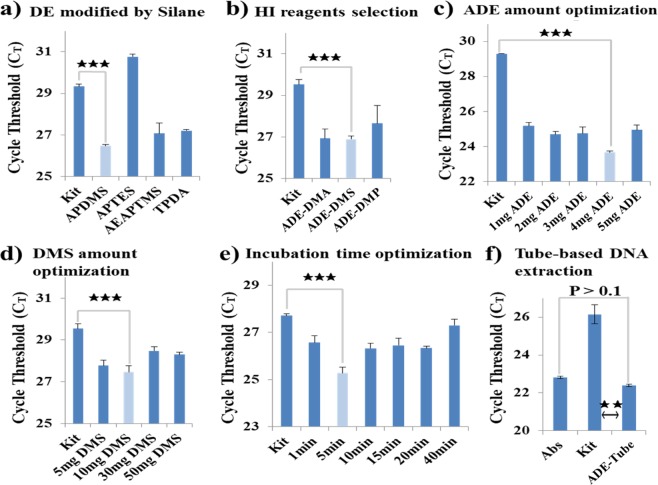
Figure 2.
The nucleic acid (NA) isolation process was optimized and evaluated based on the cycle threshold (CT) values after performing real-time quantitative PCR (qPCR). (a–e) Optimization of the RNA isolation process. (a) Screening of different silanes for DE amine functionalization (ADE) with the following protocol: 4 mg of ADE and 20 mg of DMS incubated for 10 min, washing three times, and 1 min of elution. (b) Optimization of the three different homobifunctional imidoester (HI) reagents (DMA, DMS, and DMP) with the same protocol as in (a). (c) Optimization of the amount of ADE with the following protocol: 1 to 5 mg of DA with 20 mg of DMS, incubated for 10 min; washing three times, and 1 min of elution. (d) Optimization of the amount of DMS with the following protocol: 4 mg of DE with 5, 10, 30, 50 mg of DMS incubated for 10 min; washing three times, and 1 min of elution. (e) Optimization of the incubation time for RNA isolation with the following protocol: 4 mg of DE and 20 mg of DMS, incubated for 1, 5, 10, 15, 20, and 40 min; washing three times, and 1 min of elution. (f) Evaluation of DNA templates isolated under optimized conditions. No CT values were obtained from the amplification of no-template controls (NTCs) in any of the above experiments. In all cases, the RNA was extracted from samples with the same concentration of Brucella ovis (104 CFU/mL). For the 1 mL 104 CFU/mL samples, the kit used 200 μL of the 1 mL samples whereas the tube-based assay used the entire 1 mL samples because of the difference in capacity. “Abs” refers to absolute NA references extracted from 100 μL of 105 CFU/mL samples, which contained the same amount of pathogens as the 1 mL 104 CFU/mL samples. All of the samples were diluted from the same stock solution. Details of the optimization process are provided in the supporting information. Error bars indicate standard deviation from the mean based on at least three independent experiments. The p-values were evaluated by Student’s t-test (★★★p < 0.001; ★★p < 0.01).

