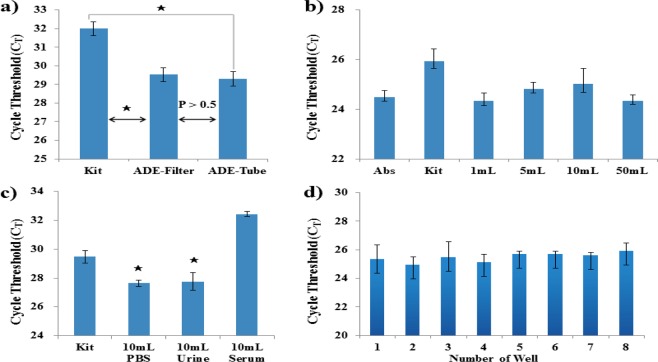
Figure 5.
Performance evaluation of the ADE-filter system for large sample volumes in various sample matrices. The total amount of pathogenic bacteria was controlled at the same sample level for all of the parallel experiments. (a) Performance of the ADE–DMS system in both tube and filter formats. Here, 1 mL of 102 CFU/mL Brucella ovis in PBS samples were used. The RNA isolation process followed that described in the sections “Tube-based pathogen enrichment and nucleic acid extraction” and “Filter-based pathogen enrichment and nucleic acid extraction.” Error bars indicate the standard deviation from the mean based on at least three independent experiments. The p-values were evaluated by Student’s t-test (★p < 0.05). (b) RNA isolated by the ADE-filter system from different volume samples (1 mL to 50 mL) containing 104 CFU of Brucella ovis in PBS. For the 1 mL (104 CFU/mL) samples, the kit used 200 μL of the 1 mL samples whereas the filter-based assay used the entire 1 mL samples because of its different capacity. “Abs” refers to the absolute NA references extracted from 100 μL (105 CFU/mL) samples, which contained the same amount of pathogens as the 1 mL of 104 CFU/mL samples. All of the samples were diluted from the same stock solution. (c) RNA isolated by the ADE-filter system from different sample matrices containing 103 CFU of Brucella ovis in all of the 10 mL PBS, urine, and serum samples. No CT values were obtained from the amplification of no-template controls (NTC) in any of these experiments. Error bars indicate standard deviation from the mean based on at least three independent experiments. The p-values were evaluated by Student’s t-test (★p < 0.05, ★★p < 0.01; different colors indicate the matched samples compared with the kit). (d) Robust testing with 96-well filter plates. DNA isolated by the ADE 96-well filter plate from the sample containing 103 CFU of Brucella ovis in the 1 mL PBS sample. Eight samples were treated simultaneously. Error bars indicate standard deviation from the mean based on at least three independent experiments.

