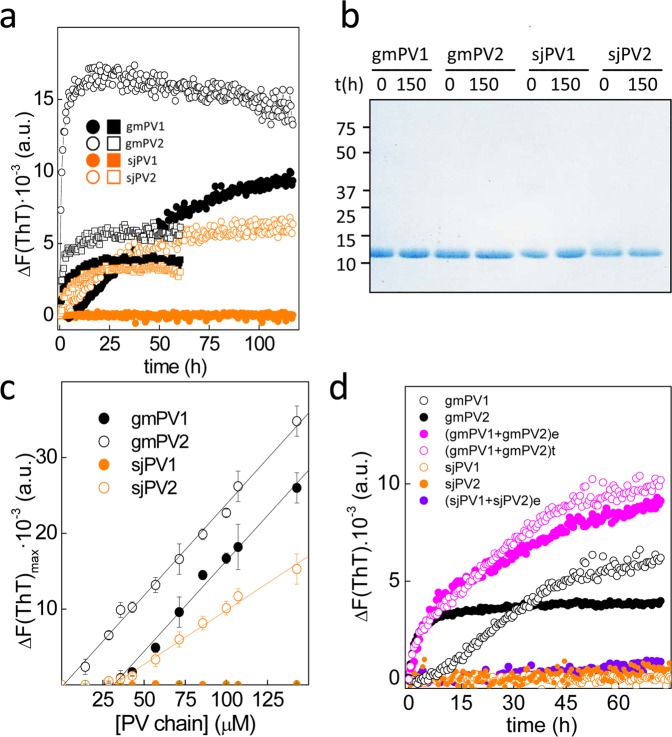
Figure 5.
Amyloid formation by β-PV isoforms. (a) ThT-binding kinetics of gmPV1 (solid black symbols), gmPV2 (open black symbols), sjPV1 (solid orange symbols) and sjPV2 (open orange symbols) under acidic (square) and neutral (circle) aggregation conditions. (b) SDS-PAGE analysis of β-PV monomer conservation during amyloid formation at neutral pH. The full-length gel is displayed in supplementary Fig. 5S. (c) Intensity of ThT fluorescence as a function of the concentration of β-PV monomers. Values correspond to kinetics performed at pH 7.5 in the presence of EDTA. (d) Aggregation kinetics of 75 μM PV1 in the absence and presence of 15 μM PV2 (e) obtained experimentally in mixed reactions or (t) generated theoretically summing the traces of each of the chains.

