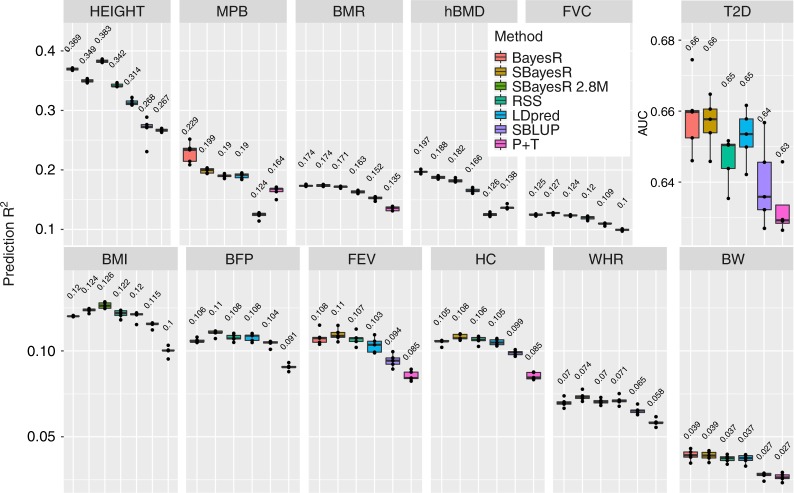
Fig. 2.
Prediction accuracy in fivefold cross-validation for 12 traits in the UK Biobank. Panel headings describe the abbreviation for 12 traits including standing height (HEIGHT, n = 347,106), male-pattern baldness (MPB, n = 125,157), basal metabolic rate (BMR, n = 341,819), heel bone mineral density T-score (hBMD, n = 197,789), forced vital capacity (FVC, n = 317,502), type 2 diabetes (T2D, n = 274,271), body mass index (BMI, n = 346,738), body fat percentage (BFP, n = 341,633), forced expiratory volume in 1 s (FEV, n = 317,502), hip circumference (HC, n = 347,231), waist-to-hip ratio (WHR, n = 347,198) and birth weight (BW, n = 197,778). Each panel shows a boxplot summary of the prediction accuracy across the five folds with the mean across the five folds displayed above each method’s boxplot. The centre line inside the box is the median, the bottom and top of the box are the first and third quartiles, respectively (Q1 and Q3), and the lower and upper whiskers are Q1 – 1.5 IQR and Q3 + 1.5 IQR, respectively, where IQR = Q3 – Q1. The points depict the prediction accuracy for each replicate. Traits are ordered by mean estimated (see Supplementary Fig. 16) from highest to lowest

