
Fig. 3.
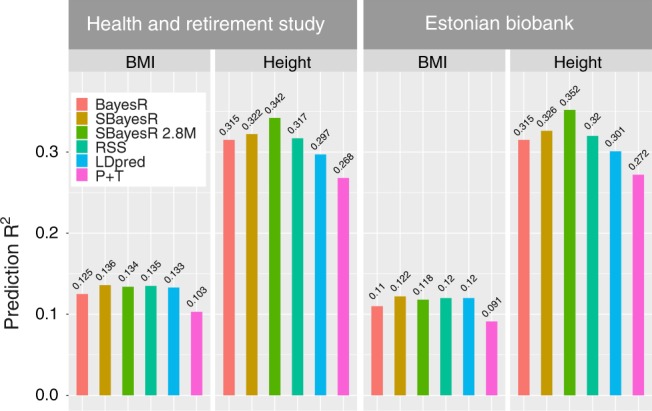
Across-biobank prediction accuracy for height and BMI. Panels depict prediction R2 (y-axis) generated from regression of the predicted phenotype on the observed phenotype for BMI and height for different methods in the independent HRS and ESTB data sets. P + T refers to the prediction R2 generated from the summary statistics of Yengo et al.48 (n ≈ 700,000), which included 6781 SNPs for BMI and 11,816 SNPs for height from a GCTA–COJO analysis thresholded at Wald test p value <0.001. The BayesR predictions were calculated by using 1,094,841 HM3 variants estimated from the full set of unrelated and related UKB European individuals (n = 453,458 and n = 454,047 for BMI and height, respectively). Summary statistics for SBayesR 2.8 million variant (SBayesR 2.8M) analysis for the UKB European individuals were generated by using the BOLT-LMM software. All other prediction R2 results were generated by using summary statistics methodology and were calculated from the analysis of summary statistics from Yengo et al.48 for 909,293 and 932,969 variants for BMI and height that overlapped with the 1,094,841 HM3 variants set used for the UKB analyses. The overlap of the sets of variants used in each of the analyses and those available in the imputed HRS and ESTB data sets for prediction had a minimum value of 98%. Supplementary Table 1 details further the figure results