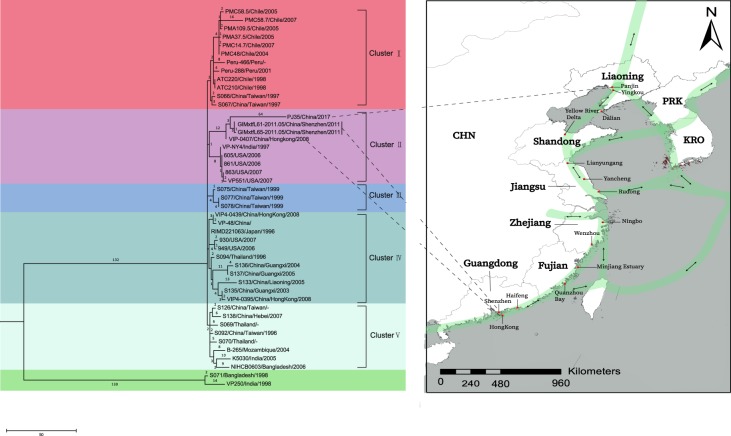
Figure 3.
The divergence of 44 ST3 V. parahaemolyticus genomes. Left: maximum parsimony tree of 44 ST3 V. parahaemolyticus genomes. Homoplasy index (HI) was 0.0 for the maximum parsimony tree. The numbers above the branches indicate the numbers of SNPs. Right: migration route of the common greenshank, with stopovers at Shenzhen, Haifeng, Quanzhou Bay, Minjiang Estuary, Rudong, Yancheng, Lianyungang, Yellow River Delta, Yingkou, and Panjin. The sampling sites were mapped by the ArcGIS Desktop 10.2 software (http://desktop.arcgis.com/).

