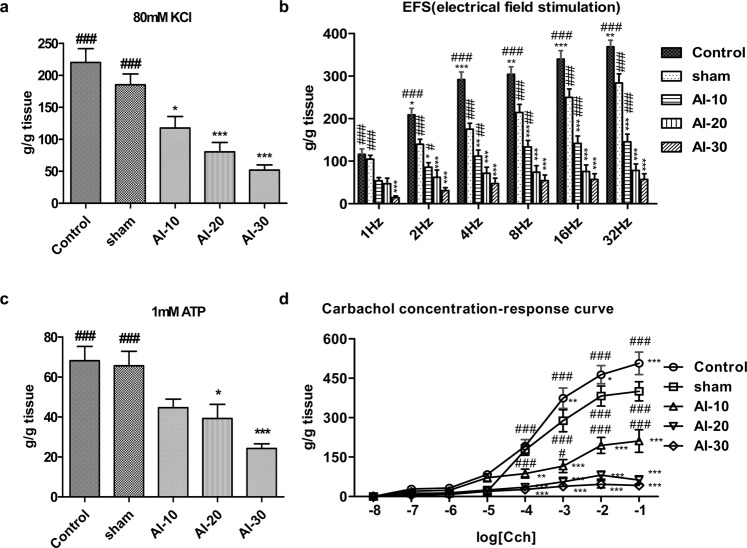
Figure 2.
Functional loss in contraction of bladder smooth muscle by the chronic bladder ischemia (a,d) Organ bath analysis for contractile response of bladder muscle in the indicated groups; (a) Contractile response to 80 mM KCl; (b) frequency–response to EFS; (c) contractile response to 1 mM ATP; and (d) concentration–response curve to carbachol. Control n = 7 (14 bladder strips); sham n = 7 (14 bladder strips); AI-10 n = 6 (12 bladder strips); AI-20 n = 7 (14 bladder strips); AI-30 n = 7 (14 bladder strips). All data are presented as mean ± SEM, *p < 0.05, **p < 0.01, ***p < 0.001 compared to the sham group; #p < 0.05, ##p < 0.01, ###p < 0.001 compared to the AI-30 group. Source data with exact p-values and number of replicates can be found in the Supplementary Dataset.

