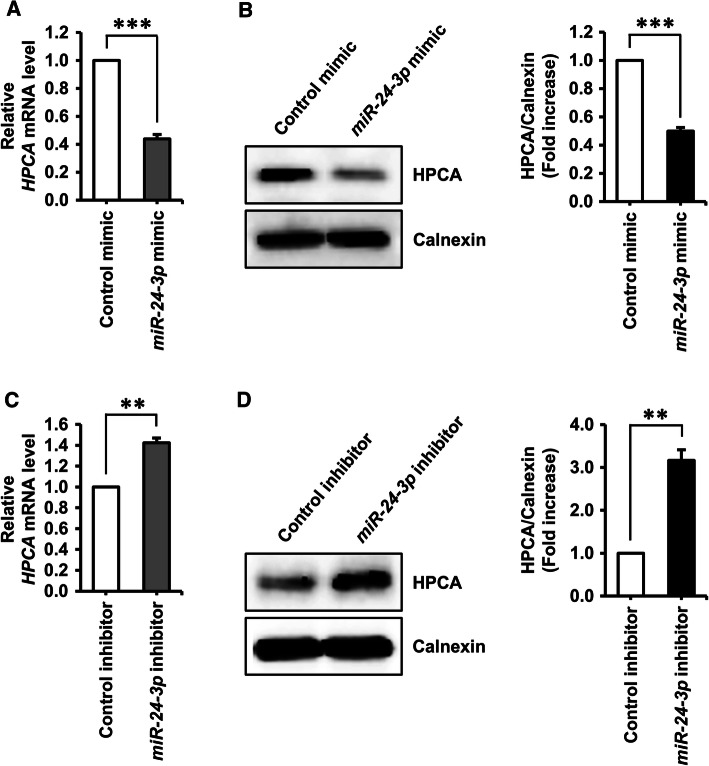
Fig. 4.
Identification of miR-24-3p as a potential upstream regulator of HPCA. a, b HeLa cells were transiently transfected with a control miRNA mimic or an miR-24-3p mimic for 2 days. aHPCA mRNA levels were detected by RT-qPCR. b Cells were lysed and analyzed by western blotting with anti-HPCA and anti-calnexin antibodies. The graph shows mean densities as fold increases from three independent experiments (mean ± SEM). Band intensities were quantified using Quantity One® software. ***P < 0.001 compared with the control miRNA mimic. c, d Cells were transfected with a control miRNA inhibitor or an miR-24-3p inhibitor for 3 days. cHPCA mRNA levels were analyzed by RT-qPCR. d Proteins were analyzed by western blotting with anti-HPCA and anti-calnexin antibodies. The graph shows mean densities as fold increases from three independent experiments (mean ± SEM). Band intensities were quantified with Quantity One® software. **P < 0.01 compared with the control miRNA inhibitor

