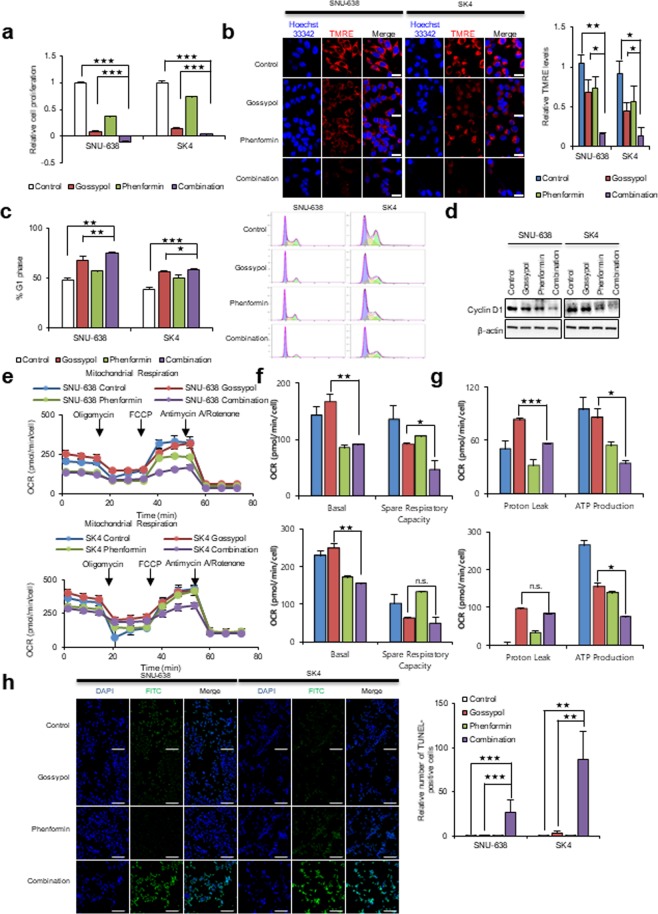
Figure 5.
Treatment with gossypol plus phenformin led to a synergistic reduction in cell proliferation via decreased ATP production. (a) Combined treatment of SNU-638 and SK4 cells with 5 μM gossypol and 100 μM phenformin for 48 h led to synergistic inhibition of cell growth. (b) Combined treatment for 24 h reduced the mitochondrial membrane potential in SNU-638 and SK4 cells, as determined by TMRE staining and live cell imaging. Scale bar = 20 μm. (c) Combined treatment led to a synergistic increase in cell cycle arrest of SNU-638 and SK4 cells at G1/S transition after 24 h, as analyzed by flow cytometry. (d) Combined treatment also reduced expression of cyclin D1 after 24 h, as analyzed by western blotting. (e–g) Combined treatment of SNU-638 and SK4 cells with 5 μM gossypol and 10 μM phenformin (12 h) led to a synergistic reduction in oxygen consumption rates and respiration parameters. (h) Treatment of SNU-638 and SK4 cells with 5 μM gossypol plus 100 μM phenformin (24 h) led to a synergistic increase in cell death (determined in a TUNEL assay). Scale bar = 200 μm. Abbreviations: Tetramethylrhodamine, ethyl ester (TMRE). Data are expressed as the mean and standard deviation of three independent experiments. *p <0.05, **p <0.01, ***p <0.001.

