
Figure 4.
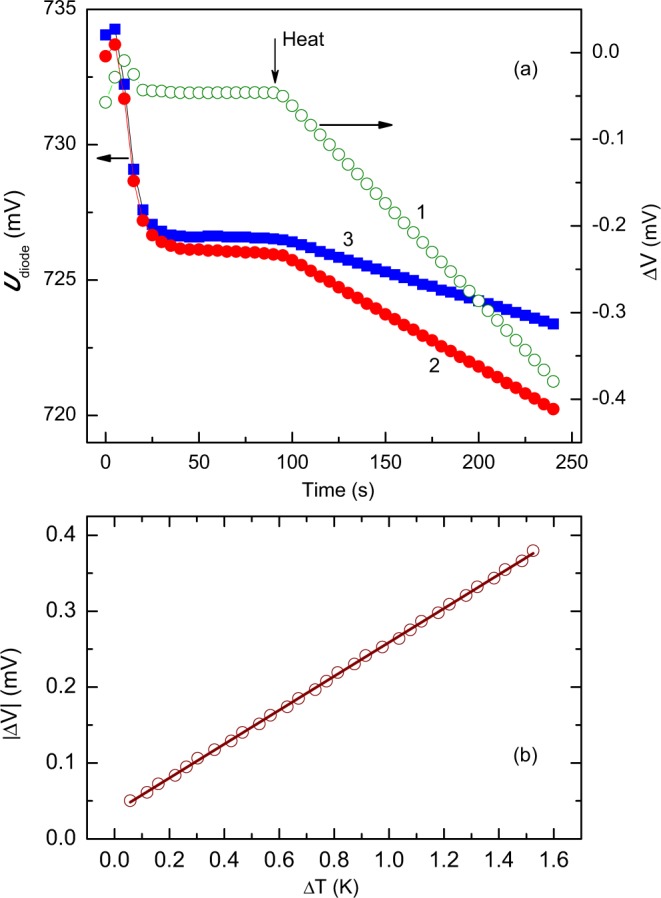
(a) Real-time monitoring of the temperature-sensing diode voltages (curves 2 and 3 correspond to diodes 2 and 3 in Fig. 3) after the cryostat temperature controller is set to 5° temperature increase at t = 0 and after the heater 1 in Fig. 3 is energised at t = 90 s. The diode voltages and ΔV (curve 1) are read with a 16 bit analog-to-digital converter (Analog Devices AD7792). (b) Voltage monitoring during Seebeck coefficient measurements in regular-QD sample at T = 243 K. Circles - experimental data. Line is a linear fit to the data yielding S = 0.223 mV/K.