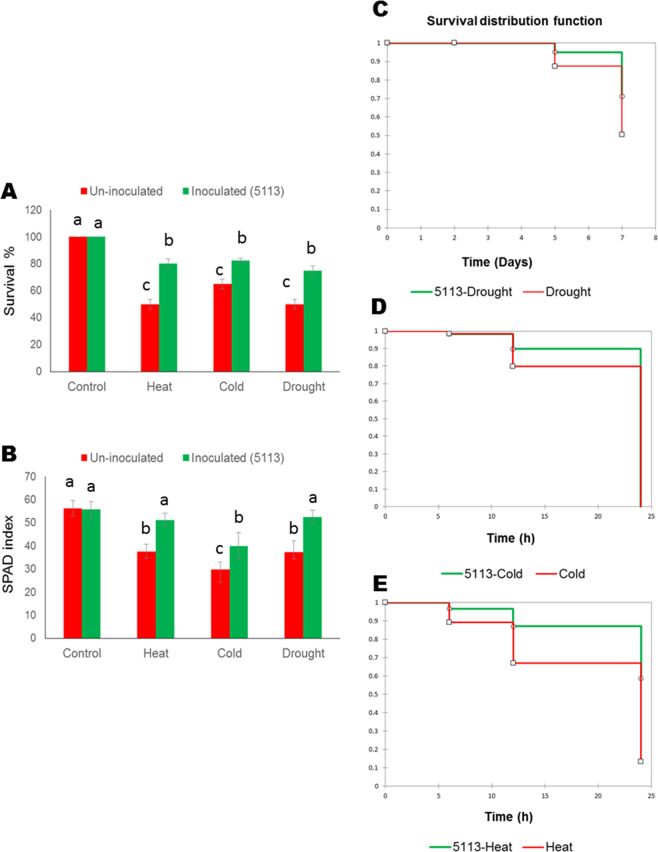
Figure 1.
Responses of 5113-treated wheat seedlings to heat stress (12 h 45°C), cold stress (12 h −5°C) and drought stress (7 days without water). (A) Survival % (calculated for 2 plant groups (20 plant each), (B) SPAD index and Kaplan Meier survival function for 5113-treated drought-stressed (C), cold-stressed (D) and heat-stressed wheat seedlings (E). Bars indicate standard deviation between 3 replicates (5 for SPAD index). Treatments labelled with identical letters are not significant at p < 0.05.

