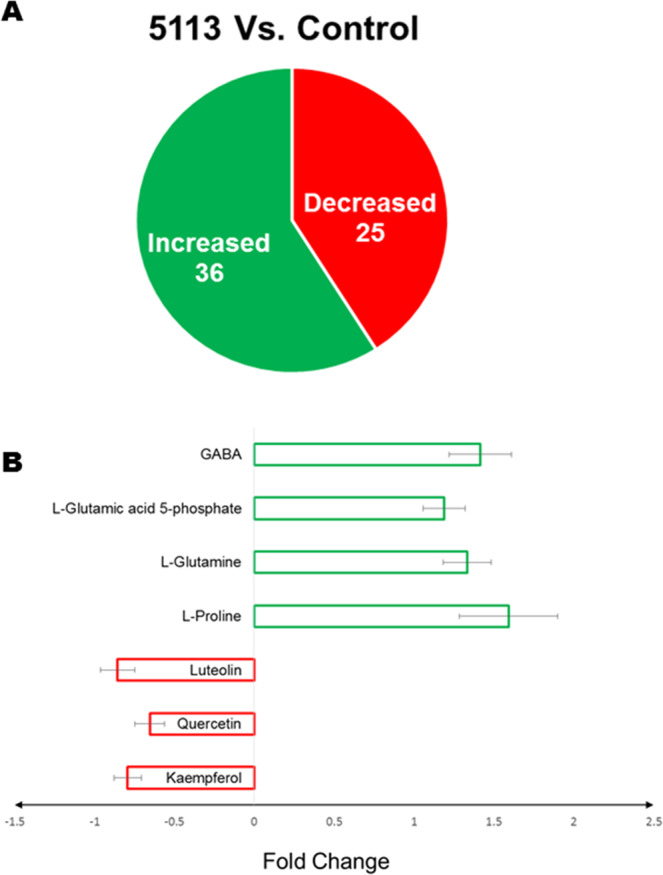
Figure 4.

Differential metabolite accumulation in the leaves of 5113-treated unstressed wheat seedlings. (A) Metabolites showing significant (p < 0.05) increase or decrease accumulation. (B) Fold change (relative to control unstressed treatment) in the accumulation of top metabolites showing significant (p < 0.05) differential accumulation. Bars indicate standard deviation between 9 data points (three biological samples and three technical repeats).
