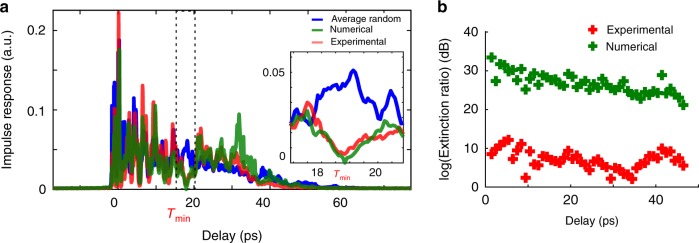
Fig. 3.
Attenuating light intensity at a chosen delay time. a Attenuating light intensity at ps. Blue: time of flight distribution of the multimode fiber. Red: experimental impulse response of the eigenstate minimizing the light intensity at . Green: numerical propagation of this eigenstate with the experimentally measured MSTM. Inset: zoom around (b) Attenuation ratio for different delay times in logarithm scale. Red: attenuation ratios calculated with the experimentally measured impulse responses. Green: attenuation ratios calculated with the numerically propagated impulse responses

