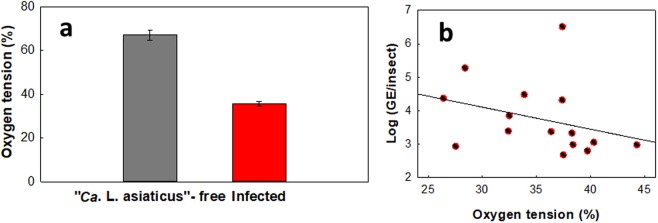
Figure 5.
Effect of infection on oxygen tension in ACP hemolymph (%). (a) Levels of oxygen tension measured in infected and uninfected ACPs. (b) Oxygen tension (%) versus log(GE/insect) in infected ACPs(two-tailed Student’s t-test, t = −11.99, P < 0.0001). No linear regression was observed between oxygen tension and GE/insect (slope = −0.066, SE = 0.055; linear regression: t = −1.19, P = 0.255, R2 = 0.09). “Ca. L. asiaticus” genomic equivalents (GE) per insect was calculated based on the standard curve, given that each “Ca. L. asiaticus” has three identical copies of the 16S rRNA gene in its genome30.

