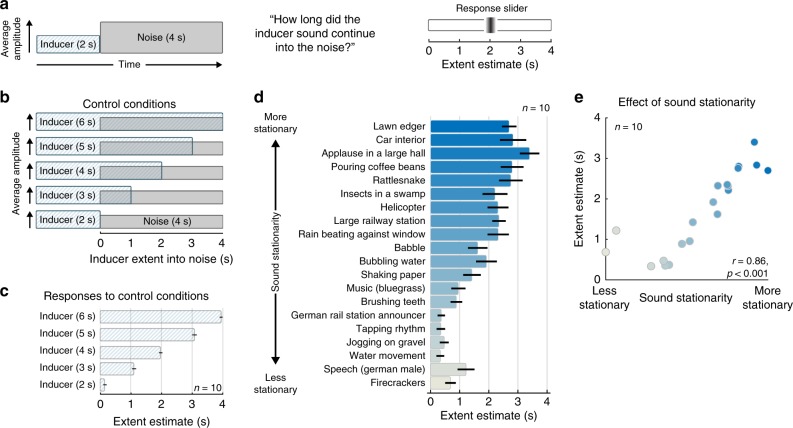
Fig. 4.
Experiment 3—estimation of the extent of illusory continuity. a Schematic of stimulus and task for main condition of Experiment 3. Inducer sounds used in the experiment were real-world sound recordings. Following the noise, participants adjusted a slider to indicate the extent over which they heard the inducer sound to continue into the noise. b Schematic of stimuli for control conditions, in which the inducer was higher in level than the noise and persisted for different amounts of time after the noise onset. c Mean estimated persistence for control conditions, pooled across inducer sounds. d Mean estimated extent of persistence for main condition of Experiment 3, plotted separately for different inducer sounds. Sounds are sorted by their stationarity. Bar color denotes inducer sound stationarity. e Mean extent estimate plotted vs. inducer sound stationarity (also denoted by the dot color, to aid comparison to panel d). Error bars plot SEM

