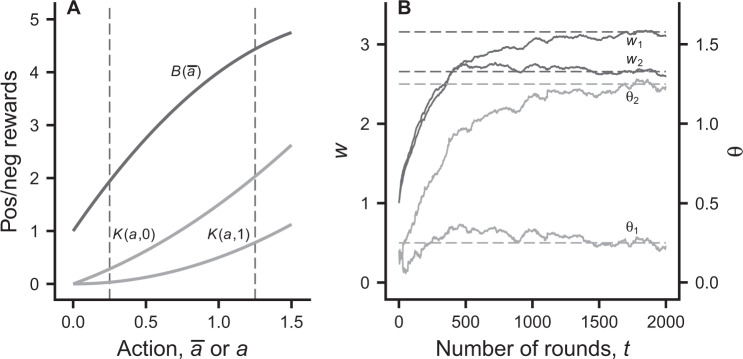
Figure 1.
Illustration of the learning model. Panel (A) illustrates the benefit and cost as functions of the investment actions. The two curves for the cost correspond to qualities q = 0 and q = 1. See Eqs (2, 3) for the formulas. Panel (B) shows simulated learning dynamics of the estimated values wi and mean actions θi for an interaction between two individuals with qualities q1 = 0 and q2 = 1. The dynamics of wi and θi are given in Eqs (7, 10). The starting point of learning was (arbitrarily) chosen as wi = 1.0 and θi = 0.2. The dashed lines are one-shot game predictions for the estimated value wi and the mean investment θi, corresponding to the investments in Eq. (14). These values of θi are also indicated in panel (A). Parameter values are: g = 2, B0 = 1, B1 = 4, B2 = −2, K1 = 1, K11 = 1, K12 = −1, σ = 0.05, αw = 0.04, and αθ = 0.002.

