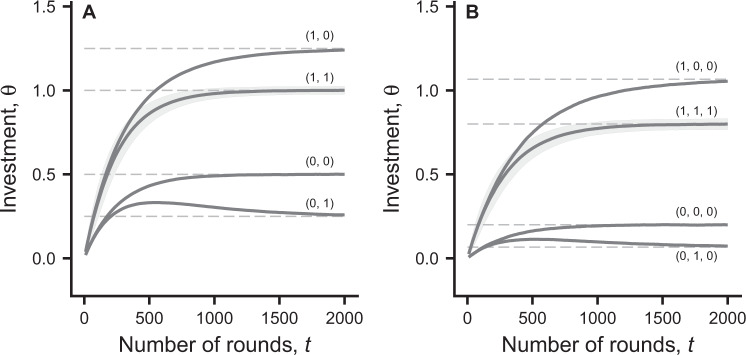
Figure 2.
Mean and SD of simulated investment actions for individual i = 1 in populations of groups, plotted over the rounds of learning. At the start of learning, individuals are assigned random qualities from the set {0, 1} and the curves are labelled with with the qualities, qi, i = 1, …, g, of individuals in a group. The spread (SD) of values of θ in the population is shown as grey shading only for the subset of groups where all qi = 1 (for clarity, to avoid overlap). Panel (A) shows all cases of group compositions with g = 2, namely groups with q1 = 1, q2 = 1; q1 = 1, q2 = 0; q1 = 0, q2 = 1; and q1 = 0, q2 = 0. Panel (B) shows a subset of cases of group compositions with g = 3, labelled q1, q2, q3. The total population size is 24 000 individuals in both panels. The dashed lines are one-shot game predictions, from Eq. (14). Other parameters are as in Fig. 1.

