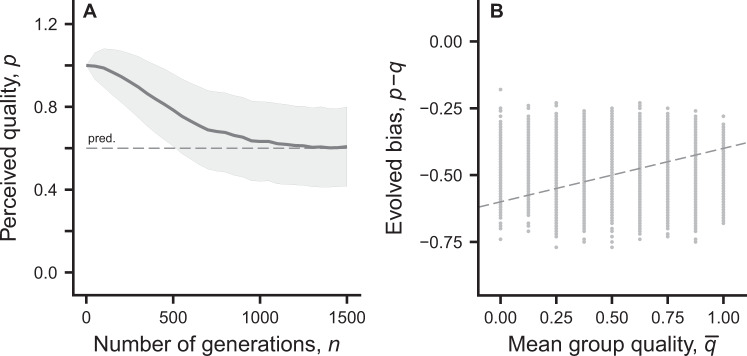
Figure 3.
Illustration of the evolution of individual perceived quality pi, through the genetically determined cognitive bias di = pi − qi, from individual-based simulation of populations similar to those illustrated in Fig. 2. Panel (A) shows evolution of mean and SD of pi = qi + di over the generations in a population with groups of size g = 2, with true qualities q1 = 1, q2 = 1 (i.e., all individuals have true quality 1). The mutation rate for alleles for di is 0.05 and the mutant increment is normally distributed with an SD of 0.04. The dashed line is the prediction from Eq. (17). Panel (B) shows the bias di, as a function of the mean quality in the group, for a population with groups of size g = 2 and with true qualities selected randomly at the start of a generation from the set {0.00, 0.25, 0.50, 0.75, 1.00}. The dashed line shows the prediction from Eq. (17) for each group composition in the final simulated generation. The mutation rate per allele for di is 0.001 with SD of mutant increments of 0.04. Other parameters are as in Fig. 1.

