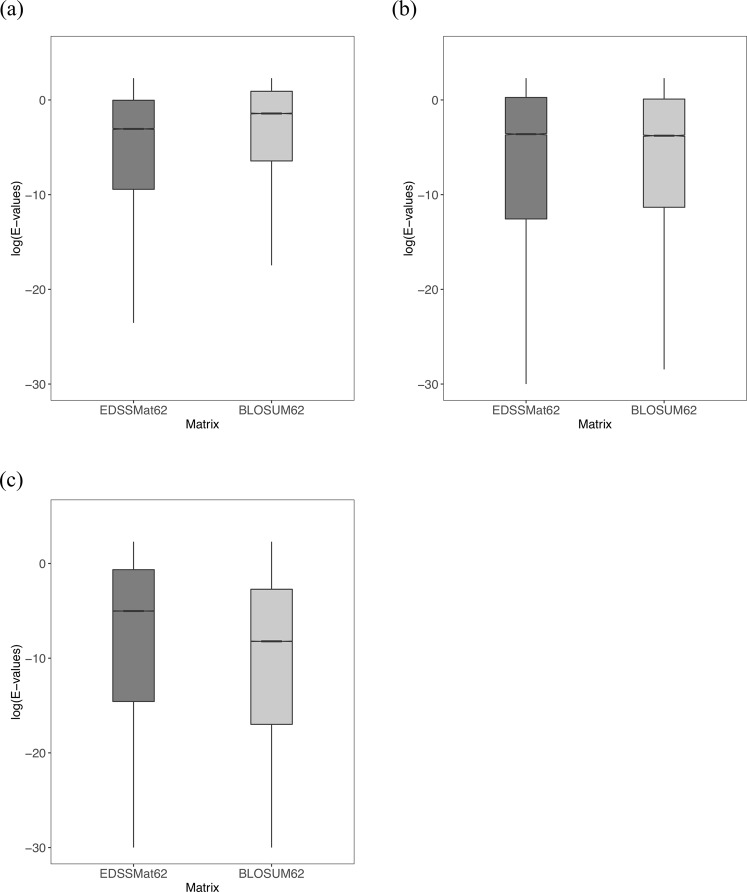
Figure 3.
Common homologs E-values distribution of BLOSUM and EDSSMat series of matrices. For representative purpose comparison of log10(E-values) distributions of common homologs of BLOSUM62 and EDSSMat62 on three different test datasets: (a) Highly Disordered (HD); (b) Moderately Disordered (MD); and (c) Less Disordered (LD) is shown here. EDSSMat62 matrix achieved lower E-values on dataset comprised of highly disordered proteins i.e. HD test dataset, whereas BLOSUM62 attained lower E-values on dataset enriched with ordered regions. Difference in E-values distributions are statistically significant (wilcoxon test, p-value is < 2.2e-16).

