
Figure 3.
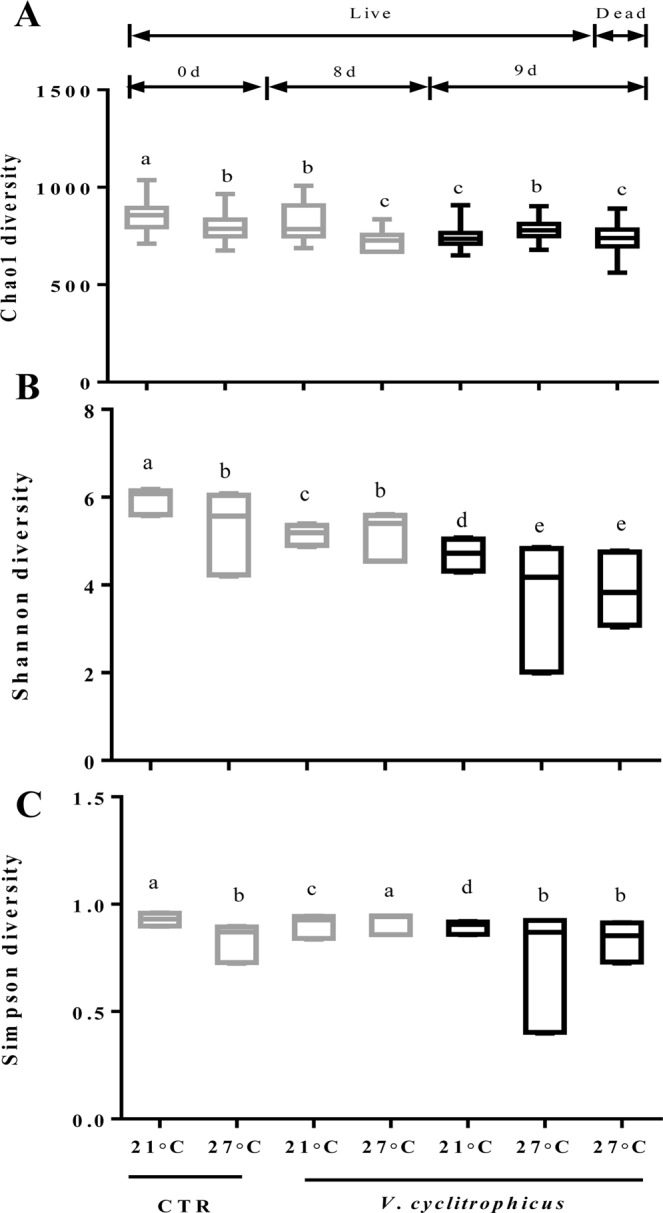
Microbial diversity indices of Chao1 (A), Shannon (B) and Simpson (C). Data are the mean ± SE (n = 3). Different letters represent significant differences (P < 0.05).
Official websites use .gov
A
.gov website belongs to an official
government organization in the United States.
Secure .gov websites use HTTPS
A lock (
) or https:// means you've safely
connected to the .gov website. Share sensitive
information only on official, secure websites.
Microbial diversity indices of Chao1 (A), Shannon (B) and Simpson (C). Data are the mean ± SE (n = 3). Different letters represent significant differences (P < 0.05).