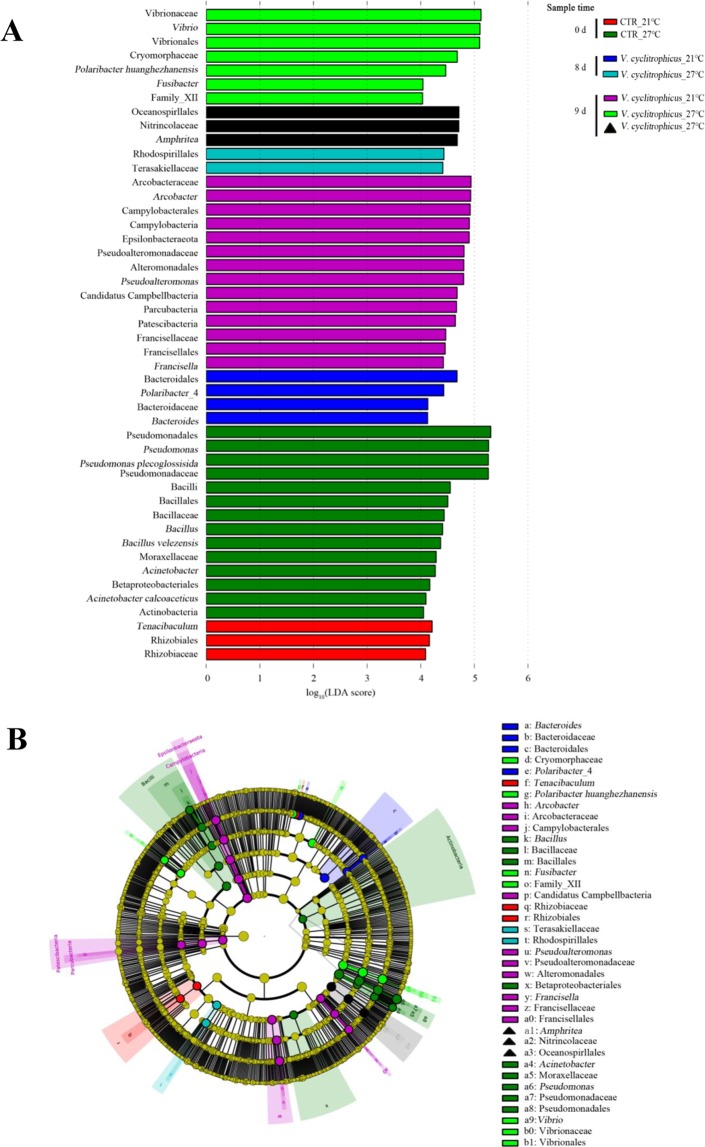
Figure 5.
Unique community composition of biomarkers in mussel haemolymph. (A) Bar chart showing the log-transformed LDA scores of bacterial taxa identified by LEfSe analysis. A log-transformed LDA score of 2 was used as a threshold for identification of significant taxa, 47 taxa were identified by LEfSe analysis and are shown (Supplementary Table 3). (B) Cladogram showing the phylogenetic relationships of 47 bacterial taxa revealed by LEfSe. The squares mean live mussels; Triangle represents dead mussels.

