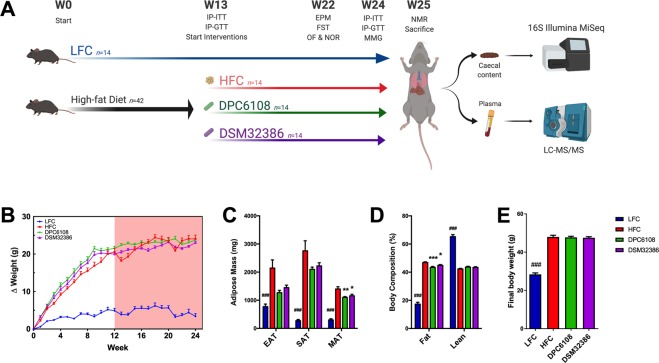
Figure 1.
L. brevis reduced fat mass and distribution of adiposity after 12 weeks of intervention. (A) Schematic figure representing mouse trial design and timeline for procedures, with high-fat diet represented by the black arrow and treatments in a 12-week intervention represented by coloured arrows. (B) Bodyweight gain throughout the pre-feeding (white background) and intervention (red background) for n = 14 mice per group. (C) Adipose tissue mass and distribution across EAT, SAT and MAT and (D) Fat and lean body composition. (E) Final body weight after 24-week feeding (HFC; n = 13 and LFC; n = 10) and 12-week intervention with DPC6108 (n = 14) and DSM32386 (n = 14). Data are expressed as mean ± SEM. Bodyweight data were analysed using the mixed model ANOVA. Tukey’s post-hoc test was applied. All other data were analysed using the appropriate unpaired student t-test (HFC vs LFC) and one-way analysis of variance (ANOVA). ###p < 0.001 HFC vs LFC, *p < 0.05 treatment vs HFC, and **p < 0.01 treatment vs HFC. IP-GTT: intraperitoneal glucose tolerance test, IP-ITT: insulin tolerance test, EPM: elevated plus maze, FST: forced swim test, OF: open field, NOR: novel object recognition, MMG: mixed meal gavage, NMR: nuclear magnetic resonance, HFC: high fat control, DPC6108: L. brevis DPC6108, DSM32386: L. brevis DSM32386, LFC: low fat control, EAT: epididymal adipose tissue, SAT: subcutaenous adipose tissue and MAT: mesenteric adipose tissue. Figure 1A was created with BioRender.com.

