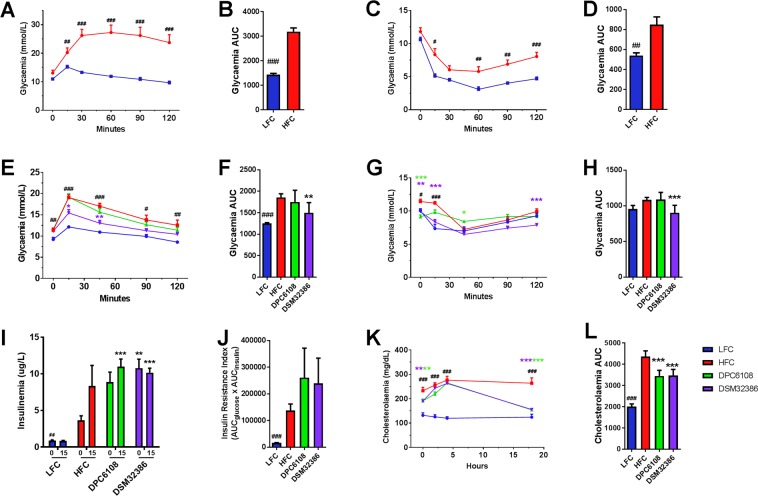
Figure 2.
L. brevis DSM32386 improved glucose clearance in the IP-GTT while both strains improved glucose-dependent insulin secretion following glucose challenge in the IP-ITT. HFC (n = 7) and LFC (n = 7) mice were assessed for 1 g/Kg glucose (IP-GTT; A,B) and 0.75 IU/Kg insulin (IP-ITT; C,D) glycaemic responses following 12 weeks of feeding, prior to commencement of treatments at week 13. At week 24 of feeding and after 10 weeks of intervention, LFC (n = 7), HFC (n = 7), DPC6108 (n = 14), and DSM32386 (n = 14) mice were assessed for glycaemic responses to glucose (E,F) and insulin (G,H) challenges. Plasma insulin concentration as determined from samples collected at T = 0 and T = 15 during glucose challenge for LFC (n = 7), HFC (n = 5), DPC6108 (n = 14) and DSM32386 (n = 12) (I) and insulin resistance index determined by multiplying the area under the curve of both the blood glucose (0 to 120 min) and the plasma insulin (0 to 15 min) obtained following glucose challenge (J). At week 24 of feeding and after 10 weeks of intervention LFC (n = 7), HFC (n = 7), DPC6108 (n = 14), DSM32386 (n = 14) mice were assessed for cholesterol metabolism by oral gavage with a complete meal, Ensure Plus, Abbott Nutrition. Total plasma cholesterol was measured at T = 0, T = 2, T = 4 and T18 hr post-gavage (K). Total AUC for cholesterol metabolism was calculated from individual time points for all groups (L). Data are expressed as mean ± SEM. All data was analysed using the appropriate unpaired student t-test (HFC vs LFC) and one-way analysis of variance (ANOVA). #p < 0.001 HFC vs LFC, ##p < 0.001 HFC vs LFC and ###p < 0.001 HFC vs LFC, *p < 0.05 treatment vs HFC, **p < 0.01 treatment vs HFC and ***p < 0.001 treatment vs HFC. AUC: area under curve, HFC: high fat control, DPC6108: L. brevis DPC6108, DSM32386: L. brevis DSM32386, LFC: low fat control.

