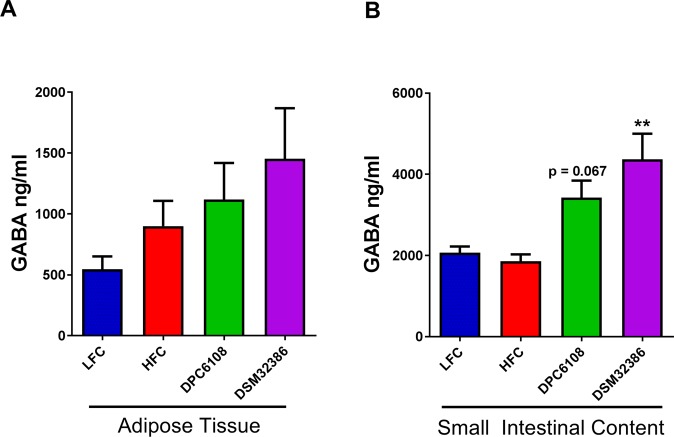
Figure 3.
L. brevis increased GABA levels in small intestinal content. GABA levels were determined from tissue samples collected at the end of the 12-week intervention from LFC (n = 8), HFC (n = 12), DPC6108 (n = 14), DSM32386 (n = 11) from epididymal adipose tissue (A) and from LFC (n = 10), HFC (n = 12), DPC6108 (n = 14), DSM32386 (n = 14) in total small intestinal content (B). Data are expressed as mean ± SEM. All data was analysed using the appropriate unpaired student t-test (HFC vs LFC) and one-way analysis of variance (ANOVA). ###p < 0.001 HFC vs LFC, **p < 0.01 treatment vs HFC. AUC: area under curve, GABA: gamma-aminobutyric acid, HFC: high fat control, DPC6108: L. brevis DPC6108, DSM32386: L. brevis DSM32386, LFC: low fat control.

