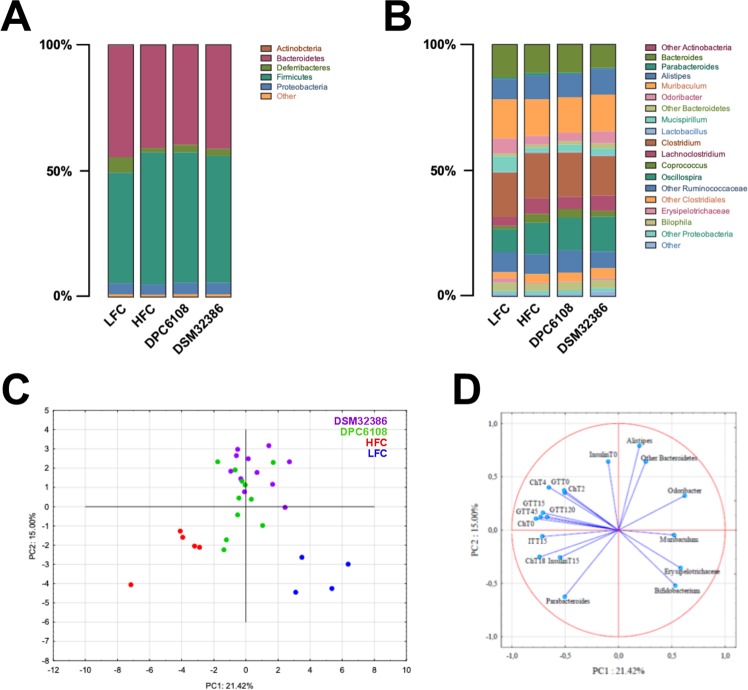
Figure 5.
Both diet and L. brevis had a significant impact on gut microbiota composition. Relative abundance of microbial taxa at (A) phylum and (B) genus level. Phyla and genera representing <0.1% abundance in any sample were considered as Other. The PCA plot based on OTU relative abundances of the bacterial community and the metabolic parameters measured in mice (C). The first two principal coordinates (PC1 and PC2) are plotted for each sample (D), with the variables related to the variance between groups. PCA: Principal Component Analysis, OTU; Operational Taxonomy Unit.

