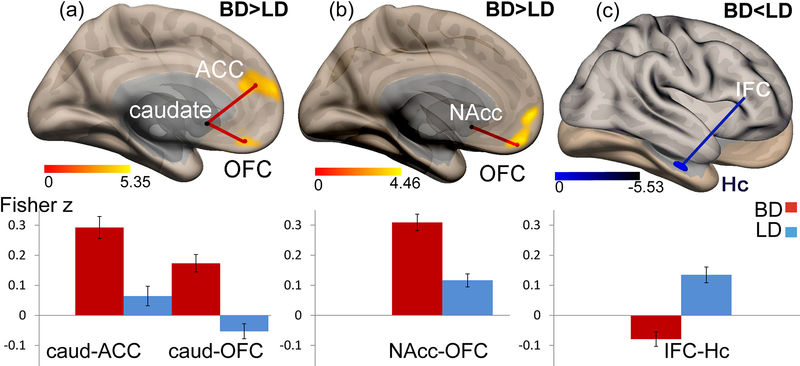
Fig. 2.
Seed-to-voxel resting state connectivity maps (upper panel) and the corresponding bar graphs of connectivity values (lower panel). Compared to LD, BD participants show (A) higher connectivity between the left caudate (seed region) and the clusters in the OFC and ACC; (B) higher connectivity between the right NAcc (seed region) and the clusters in the OFC; (C) lower connectivity between the right IFC (seed region) and the clusters in the hippocampus (Hc)

