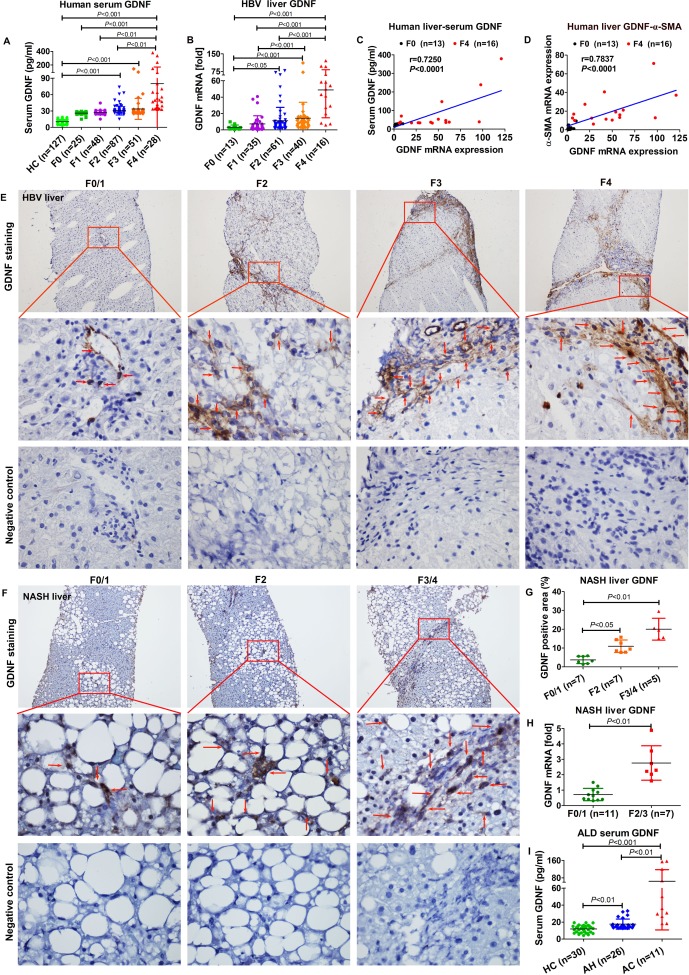
Figure 1.
Glial cell line-derived neurotrophic factor (GDNF) expression in liver fibrosis. (A) GDNF concentrations in 366 human serum samples measured by ELISA (healthy control (HC)=127; F0=25; F1=48; F2=87; F3=51; F4=28). (B) GDNF mRNA in 165 human liver specimens examined by real-time PCR. The levels of target mRNAs were normalised to that of 18S rRNA (F0=13; F1=35; F2=61; F3=40; F4=16). (C) Correlation analysis between GDNF concentrations in the serum and GDNF mRNA expression. Spearman’s correlation coefficients (r), p values and the number of patients are indicated. (D) Correlation analysis between GDNF and α-SMA mRNA expression. Spearman’s correlation coefficients (r), p values and the number of patients are indicated. (E) Immunohistochemistry of GDNF in frozen liver sections of 40 HBV patient samples (F0/1=10; F2=10; F3=10; F4=10). Upper original magnification x100, middle x600, lower x600, negative control; the red arrow indicates GDNF-positive staining. (F) Immunohistochemistry of GDNF in liver paraffin sections of non-alcoholic steatohepatitis (NASH) patient samples (F0/1=7; F2=7; F3/4=5). Upper original magnification x100, middle x600, lower x600, negative control; the red arrow indicates GDNF-positive staining. (G) Semiquantification of GDNF from figure 1F. (H) Hepatic GDNF mRNA expression in patients with NASH. (I) GDNF concentrations in serum samples from 30 HCs and 37 patients with alcoholic liver disease (ALD), as measured by ELISA (HC=30; alcoholic hepatitis (AH)=26; alcoholic cirrhosis (AC)=11). Bars indicate the mean±SD of three independent experiments; one-way analysis of variance with the non-parametric Kruskal-Wallis test was used in A, B, G–I. A non-parametric correlation (Spearman’s) two-tailed test was used in C and D.

