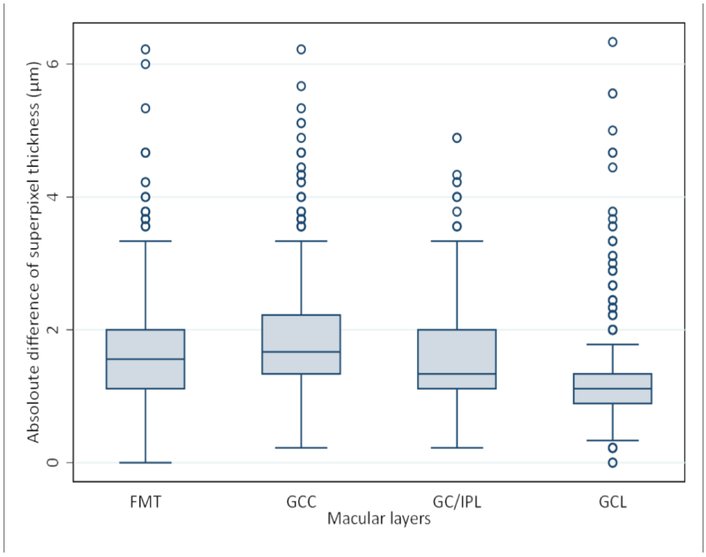
Figure 3.
Box plot shows the mean absolute difference of 9 repeat optical coherence tomography images (3 images per session and 3 sessions) at each superpixel for the macular outcomes of interest. The pairwise mean differences were statistically different among all four parameters (P <0.001, Kruskal-Wallis test). GCL, ganglion cell layer; GC/IPL, ganglion cell and inner plexiform layer; GCC, ganglion cell complex; FMT, full macular thickness.

