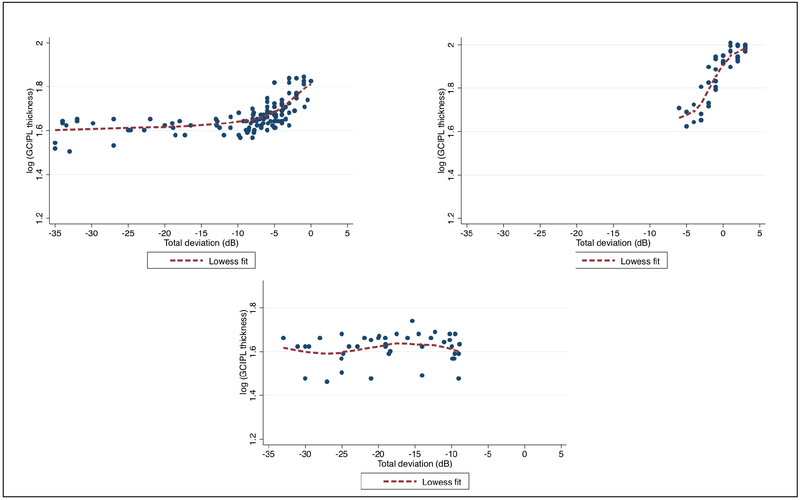
Figure 6.
Three patterns were observed after drawing bivariate plots of cross-sectional GCIPL and visual field (VF) total deviation measurements in individual eyes in the longitudinal study. Top left, a typical broken stick pattern is observed since both GCIPL thickness and VF sensitivity values vary through most or all of their entire range of measurements; top right, the GCIPL thickness measurements vary through most of their dynamic range, whereas there is limited variability in VF measurements, indicating only mild corresponding VF damage; bottom, the VF threshold values demonstrate a much wider range of variation in contrast to the GCIPL thickness measurements as the latter have reached their measurement floor.

