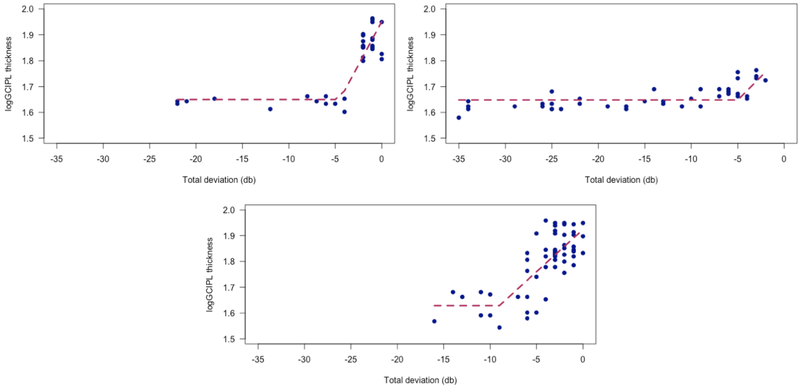
Figure 7.
Examples of longitudinal structure-function relationships in individual eyes. Top left, an eye with small variability in both macular thickness and 10–2 total deviation measurements over time. The change point was around −5 dB. Top right, fairly consistent SF relationships over multiple sessions with moderate variability. The change point is around −10 dB. Bottom, longitudinal SF plot for an eye, in which the TD values do not fall below −15 dB. The change point was estimated around −9 dB in this eye.

