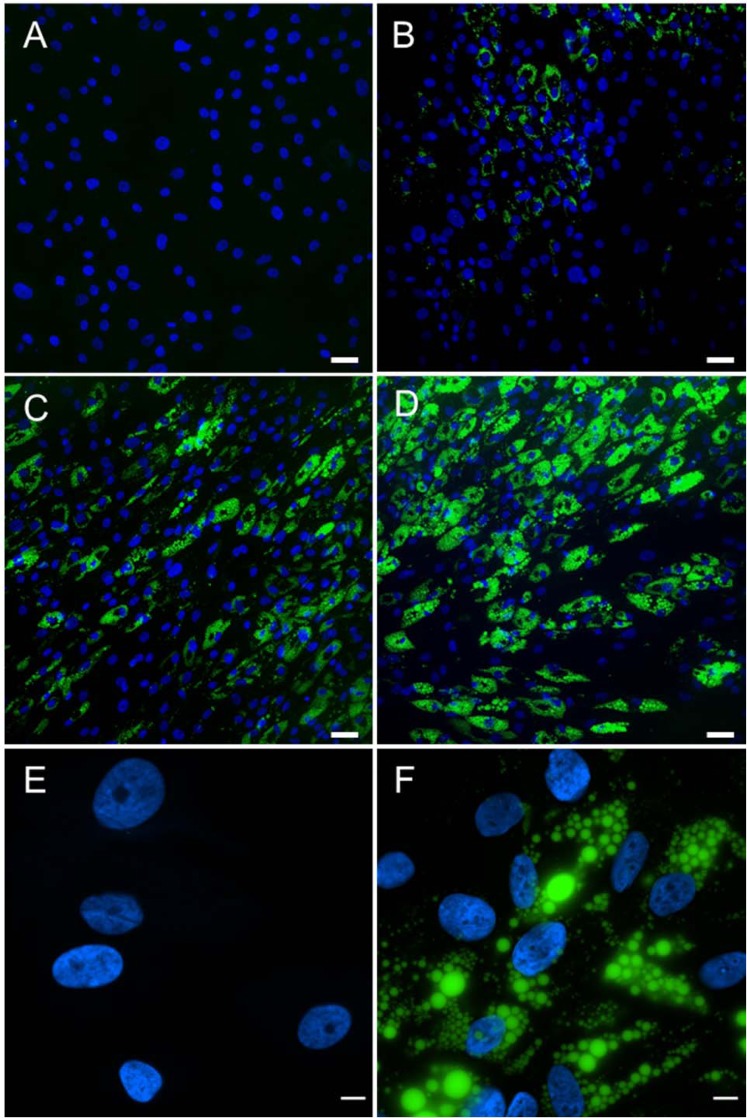
Figure 1.
Adipogenic differentiation over 15 days. MSCs underwent differentiation toward adipocytes in AD medium. Fluorescent markers observed are DAPI (blue) and LipidTOX (green). Images shown depict days 1 (A), 5 (B), 9 (C), and 15 (D). Scale bar = 50 µm (A through D). In addition, high magnification (90×) images of the nuclei and lipid droplets in hMSC during adipogenic differentiation acquired at 1 (E) and 7 (F) days. Scale bar = 10 µm (E,F).

