
Figure 7.
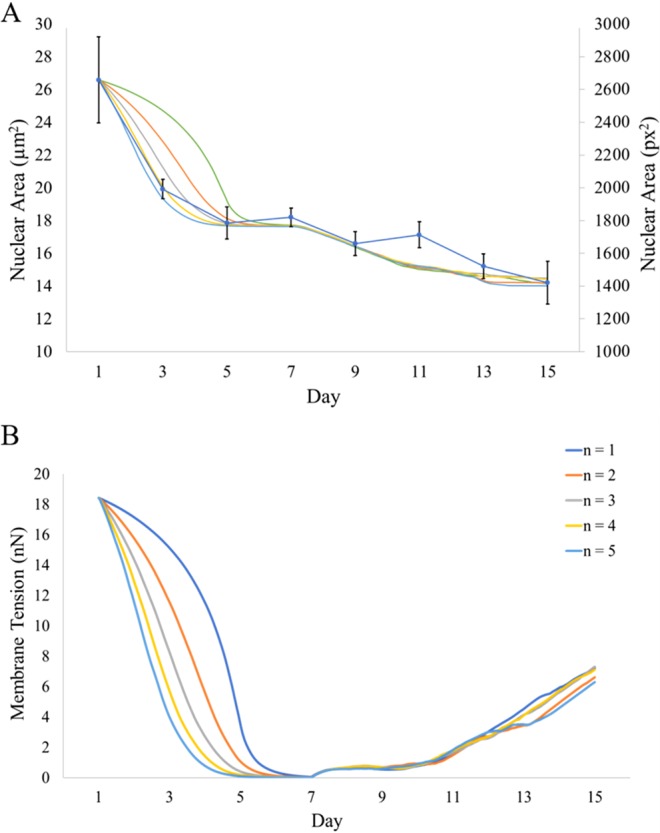
(A) Model-generated results of nuclear size demonstrating consistency with experimental data (blue curve with error bars) over 5 separate simulations. (B) Mathematical calculation of changes in the nuclear membrane tension (nN) as actin filaments reorganize and disappear. Results from 5 separate simulations are shown. Simulations are a result of increasing n from Eq. 1. It was found that the time dependence of 4th power (n = 4 shown in yellow) most closely followed experimental data.