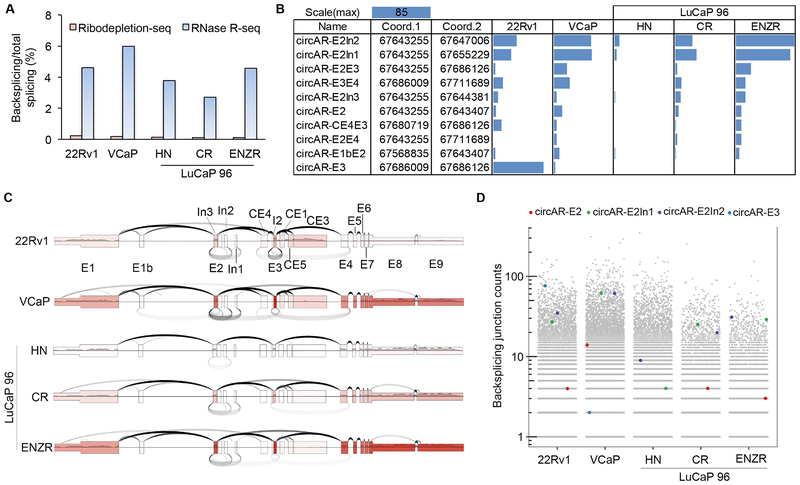
Figure 2. circAR expression in prostate cancer cell lines and LuCaP 96 PDXs by RNase R-seq method.
(A) Backsplicing to total splicing read counts showing enrichment of circRNAs in RNase R-seq data compared to ribodepletion-seq data. (B) Bar graph showing the read counts for AR backsplice junctions that have more than 4 reads in at least 1 sample in RNase R-seq data. (C) Plot showing backsplicing (under arches, from RNase R-seq), forward splicing (over arches, from polyA-seq), and exon coverage (exon color intensity, from polyA-seq) at the AR locus. The number of arches corresponds to the number of junction-spanning reads. (D) Scatter plot displaying the read counts of the most abundant clinically relevant circARs in the context of all circRNA (grey dots) read counts.

